Argentinean vs Ecuadorian Median Household Income
COMPARE
Argentinean
Ecuadorian
Median Household Income
Median Household Income Comparison
Argentineans
Ecuadorians
$93,960
MEDIAN HOUSEHOLD INCOME
99.7/ 100
METRIC RATING
69th/ 347
METRIC RANK
$82,070
MEDIAN HOUSEHOLD INCOME
12.5/ 100
METRIC RATING
217th/ 347
METRIC RANK
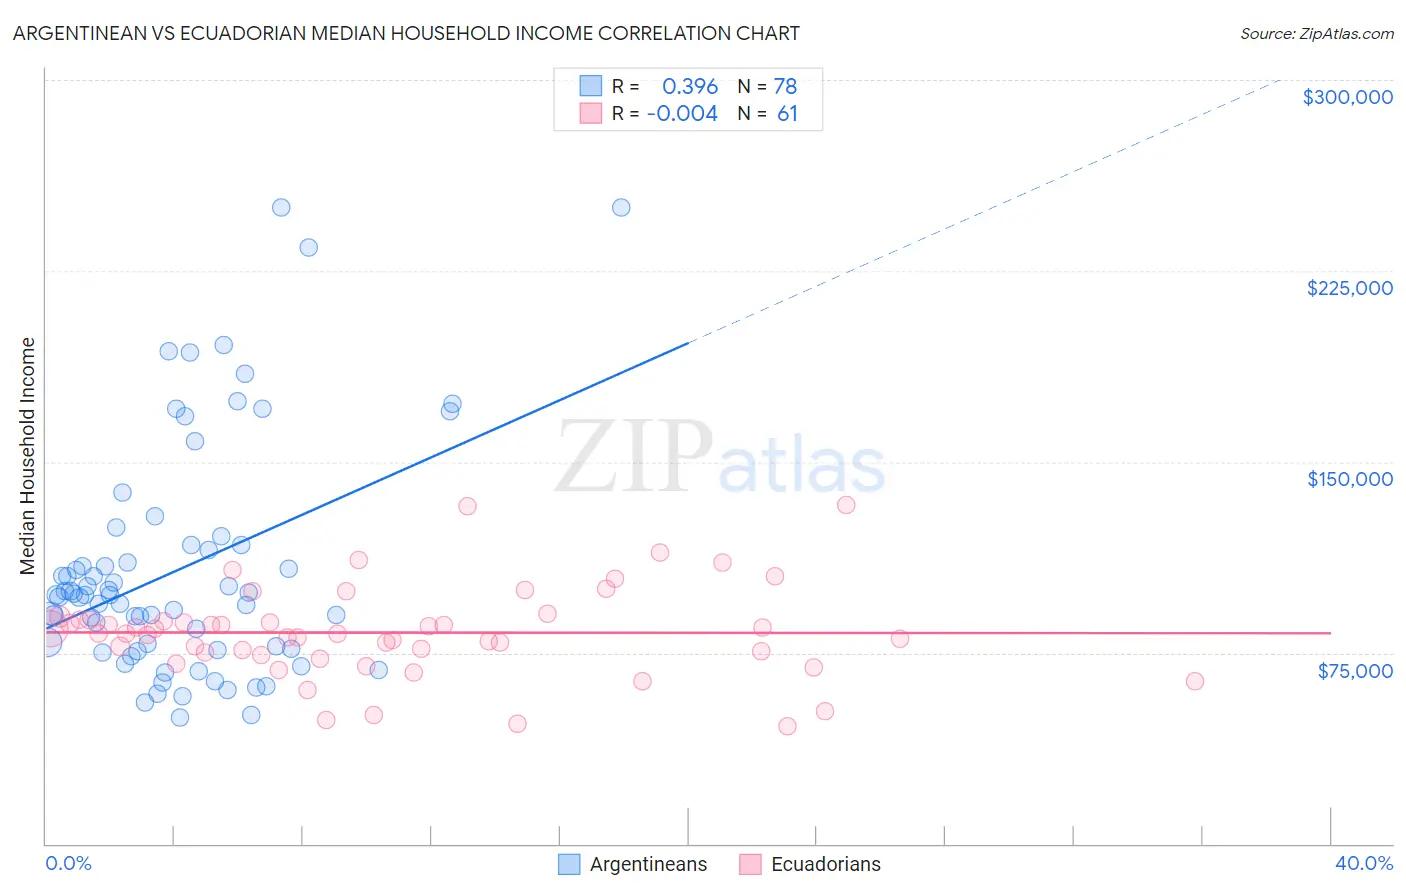
Argentinean vs Ecuadorian Median Household Income Correlation Chart
The statistical analysis conducted on geographies consisting of 296,944,042 people shows a mild positive correlation between the proportion of Argentineans and median household income in the United States with a correlation coefficient (R) of 0.396 and weighted average of $93,960. Similarly, the statistical analysis conducted on geographies consisting of 317,572,245 people shows no correlation between the proportion of Ecuadorians and median household income in the United States with a correlation coefficient (R) of -0.004 and weighted average of $82,070, a difference of 14.5%.
Median Household Income Correlation Summary
| Measurement | Argentinean | Ecuadorian |
| Minimum | $49,375 | $46,188 |
| Maximum | $250,001 | $132,837 |
| Range | $200,626 | $86,649 |
| Mean | $107,782 | $82,960 |
| Median | $97,608 | $82,671 |
| Interquartile 25% (IQ1) | $76,750 | $74,469 |
| Interquartile 75% (IQ3) | $117,422 | $87,872 |
| Interquartile Range (IQR) | $40,672 | $13,403 |
| Standard Deviation (Sample) | $45,385 | $17,786 |
| Standard Deviation (Population) | $45,093 | $17,640 |
Similar Demographics by Median Household Income
Demographics Similar to Argentineans by Median Household Income
In terms of median household income, the demographic groups most similar to Argentineans are Mongolian ($93,971, a difference of 0.010%), Immigrants from Fiji ($93,933, a difference of 0.030%), Immigrants from Philippines ($93,899, a difference of 0.070%), Lithuanian ($93,852, a difference of 0.11%), and Immigrants from Scotland ($94,091, a difference of 0.14%).
| Demographics | Rating | Rank | Median Household Income |
| Immigrants | Norway | 99.8 /100 | #62 | Exceptional $94,846 |
| Greeks | 99.8 /100 | #63 | Exceptional $94,735 |
| Immigrants | Netherlands | 99.7 /100 | #64 | Exceptional $94,411 |
| Immigrants | Belarus | 99.7 /100 | #65 | Exceptional $94,399 |
| Immigrants | Romania | 99.7 /100 | #66 | Exceptional $94,222 |
| Immigrants | Scotland | 99.7 /100 | #67 | Exceptional $94,091 |
| Mongolians | 99.7 /100 | #68 | Exceptional $93,971 |
| Argentineans | 99.7 /100 | #69 | Exceptional $93,960 |
| Immigrants | Fiji | 99.7 /100 | #70 | Exceptional $93,933 |
| Immigrants | Philippines | 99.6 /100 | #71 | Exceptional $93,899 |
| Lithuanians | 99.6 /100 | #72 | Exceptional $93,852 |
| Immigrants | Egypt | 99.6 /100 | #73 | Exceptional $93,700 |
| Immigrants | Latvia | 99.6 /100 | #74 | Exceptional $93,602 |
| Immigrants | Italy | 99.5 /100 | #75 | Exceptional $93,465 |
| South Africans | 99.5 /100 | #76 | Exceptional $93,379 |
Demographics Similar to Ecuadorians by Median Household Income
In terms of median household income, the demographic groups most similar to Ecuadorians are White/Caucasian ($82,029, a difference of 0.050%), Yugoslavian ($82,186, a difference of 0.14%), Vietnamese ($82,248, a difference of 0.22%), Panamanian ($82,272, a difference of 0.25%), and Nepalese ($82,410, a difference of 0.41%).
| Demographics | Rating | Rank | Median Household Income |
| Immigrants | Uruguay | 16.4 /100 | #210 | Poor $82,560 |
| Salvadorans | 15.4 /100 | #211 | Poor $82,449 |
| Venezuelans | 15.3 /100 | #212 | Poor $82,432 |
| Nepalese | 15.1 /100 | #213 | Poor $82,410 |
| Panamanians | 14.0 /100 | #214 | Poor $82,272 |
| Vietnamese | 13.8 /100 | #215 | Poor $82,248 |
| Yugoslavians | 13.3 /100 | #216 | Poor $82,186 |
| Ecuadorians | 12.5 /100 | #217 | Poor $82,070 |
| Whites/Caucasians | 12.2 /100 | #218 | Poor $82,029 |
| Nigerians | 10.3 /100 | #219 | Poor $81,725 |
| Immigrants | Venezuela | 9.0 /100 | #220 | Tragic $81,506 |
| Immigrants | Ghana | 9.0 /100 | #221 | Tragic $81,489 |
| Immigrants | Nigeria | 7.7 /100 | #222 | Tragic $81,236 |
| Immigrants | El Salvador | 7.6 /100 | #223 | Tragic $81,213 |
| Malaysians | 7.0 /100 | #224 | Tragic $81,064 |