Arab vs Navajo Wage/Income Gap

COMPARE

Arab
Race
Ancestry
AfghanAfricanAlaska NativeAlaskan AthabascanAlbanianAleutAlsatianAmericanApacheArabArapahoArgentineanArmenianAssyrian/Chaldean/SyriacAustralianAustrianBahamianBangladeshiBarbadianBasqueBelgianBelizeanBermudanBhutaneseBlackfeetBolivianBrazilianBritishBritish West IndianBulgarianBurmeseCajunCambodianCanadianCape VerdeanCarpatho RusynCelticCentral AmericanCentral American IndianCherokeeCheyenneChickasawChileanChineseChippewaChoctawColombianColvilleComancheCosta RicanCreeCreekCroatianCrowCubanCypriotCzechCzechoslovakianDanishDelawareDominicanDutchDutch West IndianEastern EuropeanEcuadorianEgyptianEnglishEstonianEthiopianEuropeanFijianFilipinoFinnishFrenchFrench American IndianFrench CanadianGermanGerman RussianGhanaianGreekGuamanian/ChamorroGuatemalanGuyaneseHaitianHmongHonduranHopiHoumaHungarianIcelanderIndian (Asian)IndonesianInupiatIranianIraqiIrishIroquoisIsraeliItalianJamaicanJapaneseJordanianKenyanKiowaKoreanLaotianLatvianLebaneseLiberianLithuanianLumbeeLuxembourgerMacedonianMalaysianMalteseMarshalleseMenomineeMexicanMexican American IndianMongolianMoroccanNative HawaiianNepaleseNew ZealanderNicaraguanNigerianNorthern EuropeanNorwegianOkinawanOsageOttawaPaiutePakistaniPalestinianPanamanianParaguayanPennsylvania GermanPeruvianPimaPolishPortuguesePotawatomiPuebloPuerto RicanPuget Sound SalishRomanianRussianSalvadoranSamoanScandinavianScotch-IrishScottishSeminoleSenegaleseSerbianShoshoneSierra LeoneanSiouxSlavicSlovakSloveneSomaliSouth AfricanSouth AmericanSouth American IndianSoviet UnionSpaniardSpanishSpanish AmericanSpanish American IndianSri LankanSubsaharan AfricanSudaneseSwedishSwissSyrianTaiwaneseThaiTlingit-HaidaTohono O'OdhamTonganTrinidadian and TobagonianTsimshianTurkishU.S. Virgin IslanderUgandanUkrainianUruguayanUteVenezuelanVietnameseWelshWest IndianYakamaYaquiYugoslavianYumanYup'ikZimbabwean
Immigration
NonimmigrantsImmigrantsAfghanistanAfricaAlbaniaArgentinaArmeniaAsiaAustraliaAustriaBahamasBangladeshBarbadosBelarusBelgiumBelizeBoliviaBosnia and HerzegovinaBrazilBulgariaBurma/MyanmarCabo VerdeCambodiaCameroonCanadaCaribbeanCentral AmericaChileChinaColombiaCongoCosta RicaCroatiaCubaCzechoslovakiaDenmarkDominicaDominican RepublicEastern AfricaEastern AsiaEastern EuropeEcuadorEgyptEl SalvadorEnglandEritreaEthiopiaEuropeFijiFranceGermanyGhanaGreeceGrenadaGuatemalaGuyanaHaitiHondurasHong KongHungaryIndiaIndonesiaIranIraqIrelandIsraelItalyJamaicaJapanJordanKazakhstanKenyaKoreaKuwaitLaosLatin AmericaLatviaLebanonLiberiaLithuaniaMalaysiaMexicoMicronesiaMiddle AfricaMoldovaMoroccoNepalNetherlandsNicaraguaNigeriaNorth AmericaNorth MacedoniaNorthern AfricaNorthern EuropeNorwayOceaniaPakistanPanamaPeruPhilippinesPolandPortugalRomaniaRussiaSaudi ArabiaScotlandSenegalSerbiaSierra LeoneSingaporeSomaliaSouth AfricaSouth AmericaSouth Central AsiaSouth Eastern AsiaSouthern EuropeSpainSri LankaSt. Vincent and the GrenadinesSudanSwedenSwitzerlandSyriaTaiwanThailandTrinidad and TobagoTurkeyUgandaUkraineUruguayUzbekistanVenezuelaVietnamWest IndiesWestern AfricaWestern AsiaWestern EuropeYemenZaireZimbabweAzores
Navajo
Race
Ancestry
AfghanAfricanAlaska NativeAlaskan AthabascanAlbanianAleutAlsatianAmericanApacheArapahoArgentineanArmenianAssyrian/Chaldean/SyriacAustralianAustrianBahamianBangladeshiBarbadianBasqueBelgianBelizeanBermudanBhutaneseBlackfeetBolivianBrazilianBritishBritish West IndianBulgarianBurmeseCajunCambodianCanadianCape VerdeanCarpatho RusynCelticCentral AmericanCentral American IndianCherokeeCheyenneChickasawChileanChineseChippewaChoctawColombianColvilleComancheCosta RicanCreeCreekCroatianCrowCubanCypriotCzechCzechoslovakianDanishDelawareDominicanDutchDutch West IndianEastern EuropeanEcuadorianEgyptianEnglishEstonianEthiopianEuropeanFijianFilipinoFinnishFrenchFrench American IndianFrench CanadianGermanGerman RussianGhanaianGreekGuamanian/ChamorroGuatemalanGuyaneseHaitianHmongHonduranHopiHoumaHungarianIcelanderIndian (Asian)IndonesianInupiatIranianIraqiIrishIroquoisIsraeliItalianJamaicanJapaneseJordanianKenyanKiowaKoreanLaotianLatvianLebaneseLiberianLithuanianLumbeeLuxembourgerMacedonianMalaysianMalteseMarshalleseMenomineeMexicanMexican American IndianMongolianMoroccanNative HawaiianNavajoNepaleseNew ZealanderNicaraguanNigerianNorthern EuropeanNorwegianOkinawanOsageOttawaPaiutePakistaniPalestinianPanamanianParaguayanPennsylvania GermanPeruvianPimaPolishPortuguesePotawatomiPuebloPuerto RicanPuget Sound SalishRomanianRussianSalvadoranSamoanScandinavianScotch-IrishScottishSeminoleSenegaleseSerbianShoshoneSierra LeoneanSiouxSlavicSlovakSloveneSomaliSouth AfricanSouth AmericanSouth American IndianSoviet UnionSpaniardSpanishSpanish AmericanSpanish American IndianSri LankanSubsaharan AfricanSudaneseSwedishSwissSyrianTaiwaneseThaiTlingit-HaidaTohono O'OdhamTonganTrinidadian and TobagonianTsimshianTurkishU.S. Virgin IslanderUgandanUkrainianUruguayanUteVenezuelanVietnameseWelshWest IndianYakamaYaquiYugoslavianYumanYup'ikZimbabwean
Immigration
NonimmigrantsImmigrantsAfghanistanAfricaAlbaniaArgentinaArmeniaAsiaAustraliaAustriaBahamasBangladeshBarbadosBelarusBelgiumBelizeBoliviaBosnia and HerzegovinaBrazilBulgariaBurma/MyanmarCabo VerdeCambodiaCameroonCanadaCaribbeanCentral AmericaChileChinaColombiaCongoCosta RicaCroatiaCubaCzechoslovakiaDenmarkDominicaDominican RepublicEastern AfricaEastern AsiaEastern EuropeEcuadorEgyptEl SalvadorEnglandEritreaEthiopiaEuropeFijiFranceGermanyGhanaGreeceGrenadaGuatemalaGuyanaHaitiHondurasHong KongHungaryIndiaIndonesiaIranIraqIrelandIsraelItalyJamaicaJapanJordanKazakhstanKenyaKoreaKuwaitLaosLatin AmericaLatviaLebanonLiberiaLithuaniaMalaysiaMexicoMicronesiaMiddle AfricaMoldovaMoroccoNepalNetherlandsNicaraguaNigeriaNorth AmericaNorth MacedoniaNorthern AfricaNorthern EuropeNorwayOceaniaPakistanPanamaPeruPhilippinesPolandPortugalRomaniaRussiaSaudi ArabiaScotlandSenegalSerbiaSierra LeoneSingaporeSomaliaSouth AfricaSouth AmericaSouth Central AsiaSouth Eastern AsiaSouthern EuropeSpainSri LankaSt. Vincent and the GrenadinesSudanSwedenSwitzerlandSyriaTaiwanThailandTrinidad and TobagoTurkeyUgandaUkraineUruguayUzbekistanVenezuelaVietnamWest IndiesWestern AfricaWestern AsiaWestern EuropeYemenZaireZimbabweAzores
Wage/Income Gap
Income
Poverty
Unemployment
Labor Participation
Family Structure
Vehicle Availability
Education Level
Disability

Wage/Income Gap Comparison

Arabs

Navajo

Poor
Exceptional
26.6%
WAGE/INCOME GAP
12.3/ 100
METRIC RATING
210th/ 347
METRIC RANK
22.4%
WAGE/INCOME GAP
100.0/ 100
METRIC RATING
59th/ 347
METRIC RANK

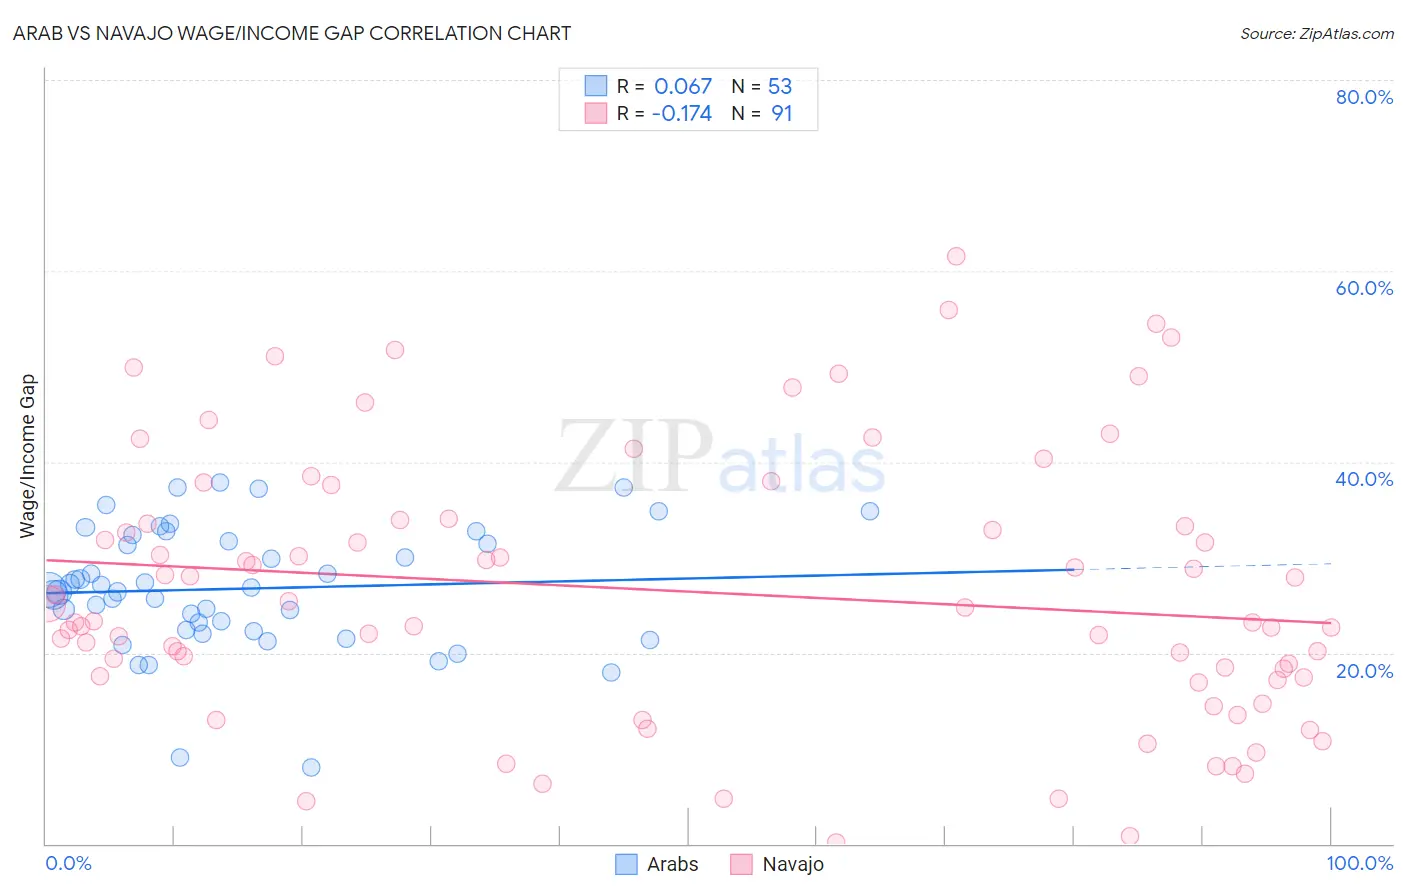
Arab vs Navajo Wage/Income Gap Correlation Chart

The statistical analysis conducted on geographies consisting of 486,307,173 people shows a slight positive correlation between the proportion of Arabs and wage/income gap percentage in the United States with a correlation coefficient (R) of 0.067 and weighted average of 26.6%. Similarly, the statistical analysis conducted on geographies consisting of 224,670,877 people shows a poor negative correlation between the proportion of Navajo and wage/income gap percentage in the United States with a correlation coefficient (R) of -0.174 and weighted average of 22.4%, a difference of 18.9%.
Arab vs Navajo Wage/Income Gap

Wage/Income Gap Correlation Summary

MeasurementArabNavajo
Minimum8.0%0.15%
Maximum37.9%61.5%
Range29.9%61.3%
Mean26.7%26.4%
Median26.6%23.3%
Interquartile 25% (IQ1)22.3%17.5%
Interquartile 75% (IQ3)32.0%33.9%
Interquartile Range (IQR)9.7%16.4%
Standard Deviation (Sample)6.5%13.9%
Standard Deviation (Population)6.4%13.8%

Similar Demographics by Wage/Income Gap

Demographics Similar to Arabs by Wage/Income Gap

In terms of wage/income gap, the demographic groups most similar to Arabs are Immigrants from Kuwait (26.6%, a difference of 0.040%), Egyptian (26.6%, a difference of 0.060%), Mongolian (26.6%, a difference of 0.13%), Iraqi (26.6%, a difference of 0.16%), and Immigrants from Iraq (26.7%, a difference of 0.31%).
DemographicsRating | RankWage/Income Gap
Immigrants | Eastern Europe
19.2
/100
|
#203
Poor
26.4%
Immigrants | Russia
19.0
/100
|
#204
Poor
26.4%
Immigrants | Southern Europe
17.3
/100
|
#205
Poor
26.4%
Indians (Asian)
16.5
/100
|
#206
Poor
26.4%
Immigrants | Italy
15.8
/100
|
#207
Poor
26.5%
Egyptians
12.7
/100
|
#208
Poor
26.6%
Immigrants | Kuwait
12.6
/100
|
#209
Poor
26.6%
Arabs
12.3
/100
|
#210
Poor
26.6%
Mongolians
11.4
/100
|
#211
Poor
26.6%
Iraqis
11.2
/100
|
#212
Poor
26.6%
Immigrants | Iraq
10.3
/100
|
#213
Poor
26.7%
Immigrants | China
10.3
/100
|
#214
Poor
26.7%
Yugoslavians
9.7
/100
|
#215
Tragic
26.7%
Immigrants | Portugal
9.5
/100
|
#216
Tragic
26.7%
Brazilians
9.2
/100
|
#217
Tragic
26.7%

Demographics Similar to Navajo by Wage/Income Gap

In terms of wage/income gap, the demographic groups most similar to Navajo are Immigrants from Middle Africa (22.4%, a difference of 0.020%), Immigrants from Cuba (22.4%, a difference of 0.040%), Ghanaian (22.3%, a difference of 0.12%), Immigrants from Fiji (22.4%, a difference of 0.19%), and Immigrants from Ghana (22.3%, a difference of 0.22%).
DemographicsRating | RankWage/Income Gap
Immigrants | Cameroon
100.0
/100
|
#52
Exceptional
22.2%
Bangladeshis
100.0
/100
|
#53
Exceptional
22.2%
Nepalese
100.0
/100
|
#54
Exceptional
22.2%
Immigrants | Zaire
100.0
/100
|
#55
Exceptional
22.3%
Immigrants | Ghana
100.0
/100
|
#56
Exceptional
22.3%
Ghanaians
100.0
/100
|
#57
Exceptional
22.3%
Immigrants | Cuba
100.0
/100
|
#58
Exceptional
22.4%
Navajo
100.0
/100
|
#59
Exceptional
22.4%
Immigrants | Middle Africa
100.0
/100
|
#60
Exceptional
22.4%
Immigrants | Fiji
100.0
/100
|
#61
Exceptional
22.4%
Immigrants | Guatemala
100.0
/100
|
#62
Exceptional
22.5%
Immigrants | Ecuador
100.0
/100
|
#63
Exceptional
22.5%
Spanish American Indians
100.0
/100
|
#64
Exceptional
22.5%
Guatemalans
99.9
/100
|
#65
Exceptional
22.6%
Central American Indians
99.9
/100
|
#66
Exceptional
22.7%