Arab vs Navajo Unemployment Among Youth under 25 years
COMPARE
Arab
Navajo
Unemployment Among Youth under 25 years
Unemployment Among Youth under 25 years Comparison
Arabs
Navajo
11.8%
UNEMPLOYMENT AMONG YOUTH UNDER 25 YEARS
18.0/ 100
METRIC RATING
200th/ 347
METRIC RANK
18.6%
UNEMPLOYMENT AMONG YOUTH UNDER 25 YEARS
0.0/ 100
METRIC RATING
343rd/ 347
METRIC RANK
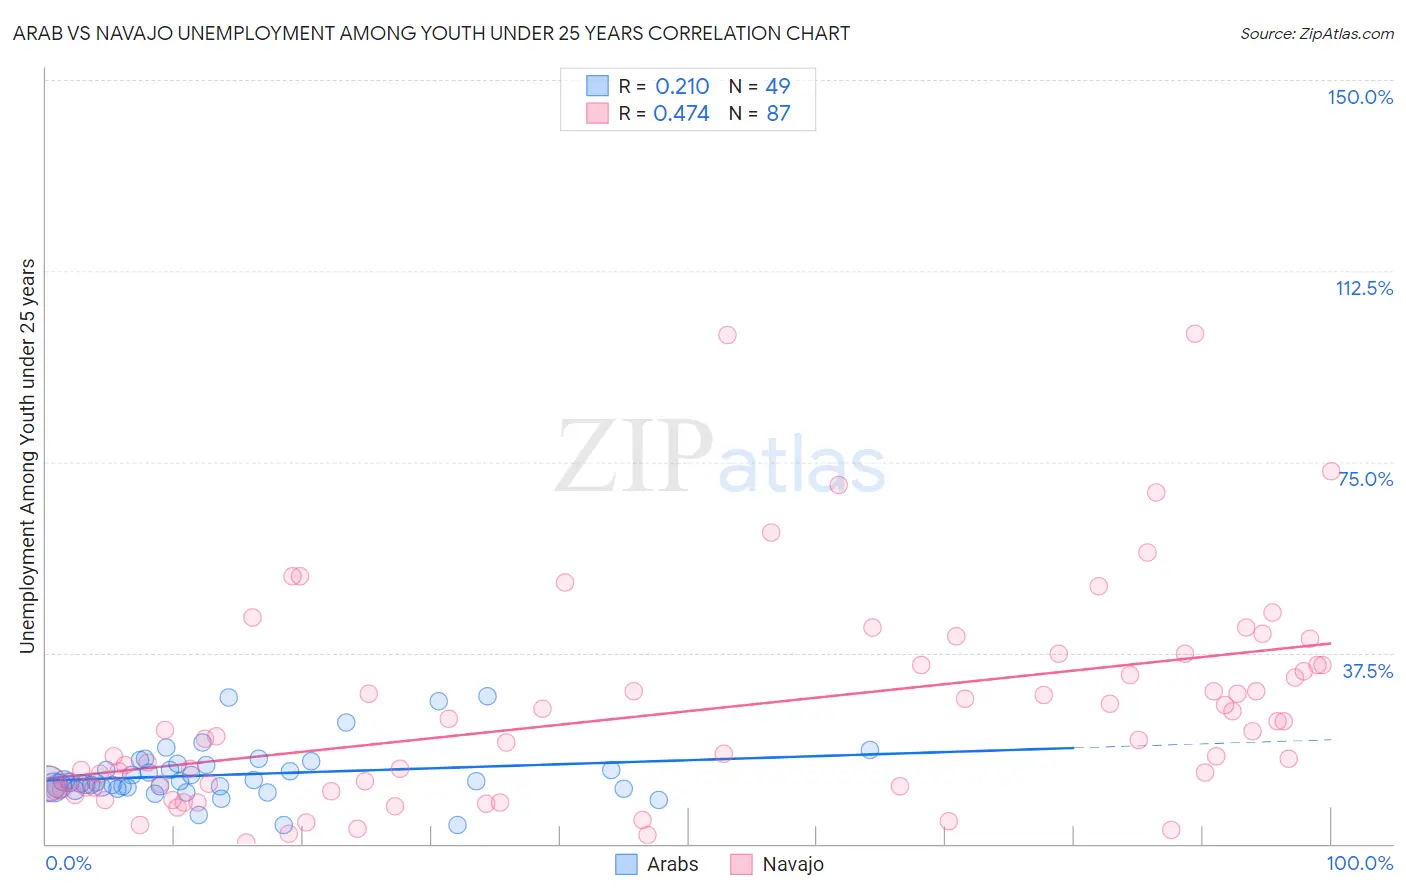
Arab vs Navajo Unemployment Among Youth under 25 years Correlation Chart
The statistical analysis conducted on geographies consisting of 478,049,168 people shows a weak positive correlation between the proportion of Arabs and unemployment rate among youth under the age of 25 in the United States with a correlation coefficient (R) of 0.210 and weighted average of 11.8%. Similarly, the statistical analysis conducted on geographies consisting of 223,013,083 people shows a moderate positive correlation between the proportion of Navajo and unemployment rate among youth under the age of 25 in the United States with a correlation coefficient (R) of 0.474 and weighted average of 18.6%, a difference of 58.0%.
Unemployment Among Youth under 25 years Correlation Summary
| Measurement | Arab | Navajo |
| Minimum | 3.6% | 0.30% |
| Maximum | 29.0% | 100.1% |
| Range | 25.4% | 99.8% |
| Mean | 13.6% | 25.7% |
| Median | 12.0% | 20.7% |
| Interquartile 25% (IQ1) | 11.0% | 11.1% |
| Interquartile 75% (IQ3) | 15.6% | 35.1% |
| Interquartile Range (IQR) | 4.5% | 24.0% |
| Standard Deviation (Sample) | 5.3% | 20.5% |
| Standard Deviation (Population) | 5.3% | 20.4% |
Similar Demographics by Unemployment Among Youth under 25 years
Demographics Similar to Arabs by Unemployment Among Youth under 25 years
In terms of unemployment among youth under 25 years, the demographic groups most similar to Arabs are Palestinian (11.8%, a difference of 0.15%), Marshallese (11.8%, a difference of 0.16%), Immigrants from Colombia (11.8%, a difference of 0.19%), Cherokee (11.8%, a difference of 0.20%), and Immigrants from Peru (11.8%, a difference of 0.20%).
| Demographics | Rating | Rank | Unemployment Among Youth under 25 years |
| Seminole | 27.9 /100 | #193 | Fair 11.7% |
| Immigrants | Sri Lanka | 27.8 /100 | #194 | Fair 11.7% |
| Paraguayans | 27.2 /100 | #195 | Fair 11.7% |
| Egyptians | 26.9 /100 | #196 | Fair 11.7% |
| Koreans | 23.9 /100 | #197 | Fair 11.7% |
| Cherokee | 21.2 /100 | #198 | Fair 11.8% |
| Immigrants | Colombia | 20.9 /100 | #199 | Fair 11.8% |
| Arabs | 18.0 /100 | #200 | Poor 11.8% |
| Palestinians | 16.0 /100 | #201 | Poor 11.8% |
| Marshallese | 15.8 /100 | #202 | Poor 11.8% |
| Immigrants | Peru | 15.3 /100 | #203 | Poor 11.8% |
| Immigrants | Costa Rica | 15.2 /100 | #204 | Poor 11.8% |
| Peruvians | 14.0 /100 | #205 | Poor 11.8% |
| Immigrants | Pakistan | 12.6 /100 | #206 | Poor 11.8% |
| Immigrants | Southern Europe | 12.3 /100 | #207 | Poor 11.8% |
Demographics Similar to Navajo by Unemployment Among Youth under 25 years
In terms of unemployment among youth under 25 years, the demographic groups most similar to Navajo are Puerto Rican (18.4%, a difference of 1.2%), Paiute (17.6%, a difference of 6.0%), Crow (20.1%, a difference of 7.8%), Colville (16.8%, a difference of 11.1%), and Tsimshian (16.5%, a difference of 13.0%).
| Demographics | Rating | Rank | Unemployment Among Youth under 25 years |
| Guyanese | 0.0 /100 | #333 | Tragic 15.9% |
| Immigrants | Guyana | 0.0 /100 | #334 | Tragic 15.9% |
| Immigrants | St. Vincent and the Grenadines | 0.0 /100 | #335 | Tragic 16.1% |
| Pima | 0.0 /100 | #336 | Tragic 16.2% |
| Arapaho | 0.0 /100 | #337 | Tragic 16.3% |
| Yuman | 0.0 /100 | #338 | Tragic 16.3% |
| Tsimshian | 0.0 /100 | #339 | Tragic 16.5% |
| Colville | 0.0 /100 | #340 | Tragic 16.8% |
| Paiute | 0.0 /100 | #341 | Tragic 17.6% |
| Puerto Ricans | 0.0 /100 | #342 | Tragic 18.4% |
| Navajo | 0.0 /100 | #343 | Tragic 18.6% |
| Crow | 0.0 /100 | #344 | Tragic 20.1% |
| Hopi | 0.0 /100 | #345 | Tragic 21.5% |
| Inupiat | 0.0 /100 | #346 | Tragic 22.0% |
| Yup'ik | 0.0 /100 | #347 | Tragic 23.7% |