Apache vs Zimbabwean Median Female Earnings
COMPARE
Apache
Zimbabwean
Median Female Earnings
Median Female Earnings Comparison
Apache
Zimbabweans
$34,895
MEDIAN FEMALE EARNINGS
0.0/ 100
METRIC RATING
314th/ 347
METRIC RANK
$40,798
MEDIAN FEMALE EARNINGS
90.8/ 100
METRIC RATING
129th/ 347
METRIC RANK
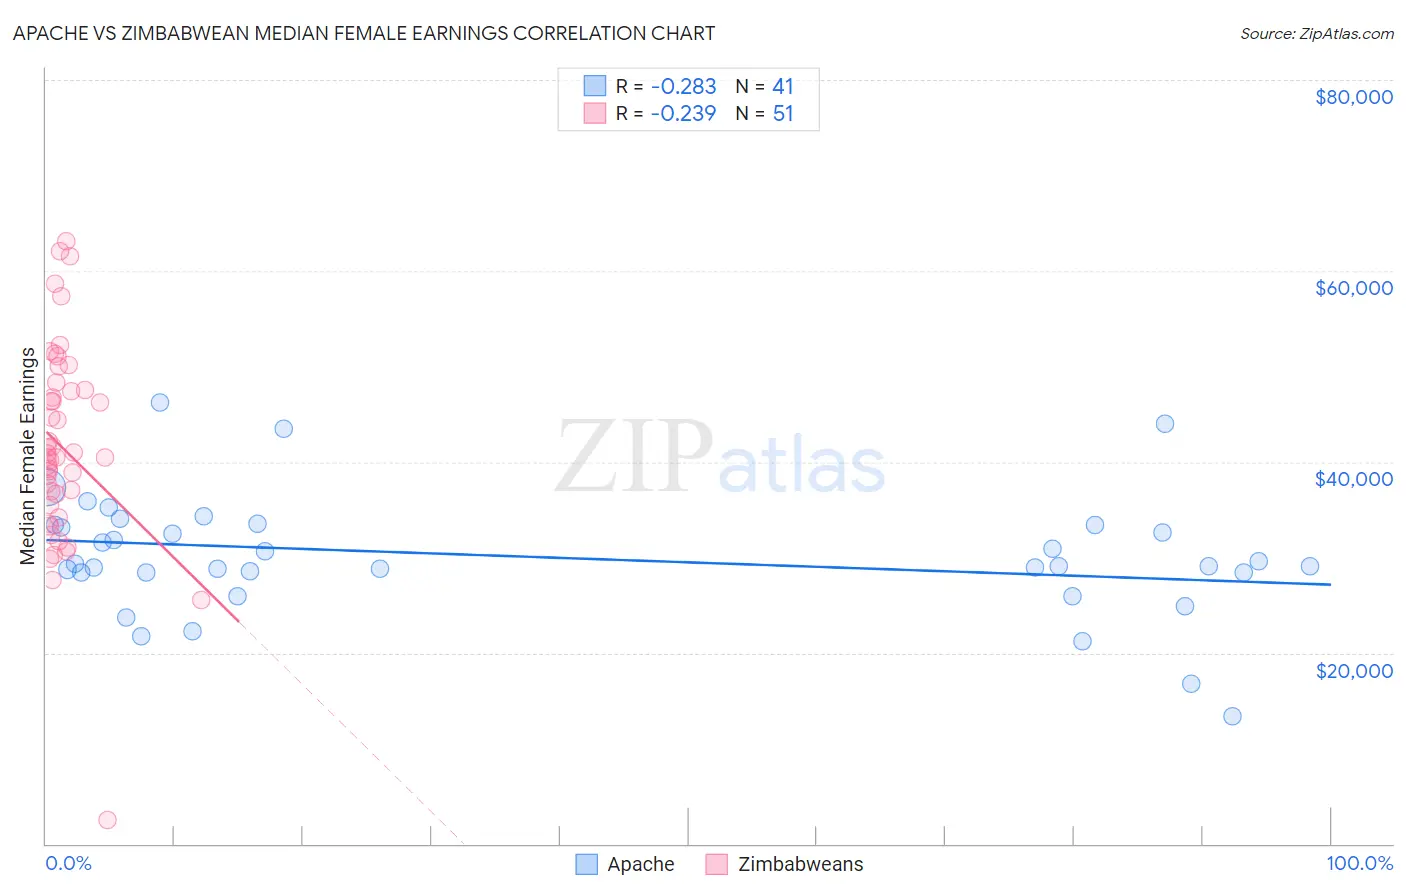
Apache vs Zimbabwean Median Female Earnings Correlation Chart
The statistical analysis conducted on geographies consisting of 230,997,872 people shows a weak negative correlation between the proportion of Apache and median female earnings in the United States with a correlation coefficient (R) of -0.283 and weighted average of $34,895. Similarly, the statistical analysis conducted on geographies consisting of 69,205,831 people shows a weak negative correlation between the proportion of Zimbabweans and median female earnings in the United States with a correlation coefficient (R) of -0.239 and weighted average of $40,798, a difference of 16.9%.
Median Female Earnings Correlation Summary
| Measurement | Apache | Zimbabwean |
| Minimum | $13,381 | $2,499 |
| Maximum | $46,250 | $63,108 |
| Range | $32,869 | $60,609 |
| Mean | $30,090 | $41,512 |
| Median | $29,044 | $40,486 |
| Interquartile 25% (IQ1) | $28,433 | $35,420 |
| Interquartile 75% (IQ3) | $33,369 | $47,538 |
| Interquartile Range (IQR) | $4,936 | $12,118 |
| Standard Deviation (Sample) | $6,387 | $10,575 |
| Standard Deviation (Population) | $6,309 | $10,471 |
Similar Demographics by Median Female Earnings
Demographics Similar to Apache by Median Female Earnings
In terms of median female earnings, the demographic groups most similar to Apache are Cuban ($34,942, a difference of 0.13%), Yaqui ($34,943, a difference of 0.14%), Ute ($34,960, a difference of 0.19%), Pennsylvania German ($34,802, a difference of 0.27%), and Chippewa ($35,003, a difference of 0.31%).
| Demographics | Rating | Rank | Median Female Earnings |
| Sioux | 0.0 /100 | #307 | Tragic $35,063 |
| Immigrants | Bahamas | 0.0 /100 | #308 | Tragic $35,027 |
| Hondurans | 0.0 /100 | #309 | Tragic $35,013 |
| Chippewa | 0.0 /100 | #310 | Tragic $35,003 |
| Ute | 0.0 /100 | #311 | Tragic $34,960 |
| Yaqui | 0.0 /100 | #312 | Tragic $34,943 |
| Cubans | 0.0 /100 | #313 | Tragic $34,942 |
| Apache | 0.0 /100 | #314 | Tragic $34,895 |
| Pennsylvania Germans | 0.0 /100 | #315 | Tragic $34,802 |
| Cherokee | 0.0 /100 | #316 | Tragic $34,742 |
| Potawatomi | 0.0 /100 | #317 | Tragic $34,739 |
| Immigrants | Yemen | 0.0 /100 | #318 | Tragic $34,693 |
| Shoshone | 0.0 /100 | #319 | Tragic $34,677 |
| Immigrants | Honduras | 0.0 /100 | #320 | Tragic $34,647 |
| Hispanics or Latinos | 0.0 /100 | #321 | Tragic $34,421 |
Demographics Similar to Zimbabweans by Median Female Earnings
In terms of median female earnings, the demographic groups most similar to Zimbabweans are Immigrants from Guyana ($40,773, a difference of 0.060%), Carpatho Rusyn ($40,825, a difference of 0.070%), Chilean ($40,757, a difference of 0.10%), Immigrants from Uganda ($40,739, a difference of 0.14%), and Syrian ($40,727, a difference of 0.17%).
| Demographics | Rating | Rank | Median Female Earnings |
| Immigrants | Jordan | 93.5 /100 | #122 | Exceptional $40,977 |
| Guyanese | 93.4 /100 | #123 | Exceptional $40,973 |
| Trinidadians and Tobagonians | 93.2 /100 | #124 | Exceptional $40,958 |
| Austrians | 92.7 /100 | #125 | Exceptional $40,923 |
| Immigrants | Trinidad and Tobago | 92.3 /100 | #126 | Exceptional $40,895 |
| Ugandans | 92.2 /100 | #127 | Exceptional $40,889 |
| Carpatho Rusyns | 91.2 /100 | #128 | Exceptional $40,825 |
| Zimbabweans | 90.8 /100 | #129 | Exceptional $40,798 |
| Immigrants | Guyana | 90.3 /100 | #130 | Exceptional $40,773 |
| Chileans | 90.0 /100 | #131 | Exceptional $40,757 |
| Immigrants | Uganda | 89.7 /100 | #132 | Excellent $40,739 |
| Syrians | 89.5 /100 | #133 | Excellent $40,727 |
| Arabs | 89.3 /100 | #134 | Excellent $40,718 |
| Immigrants | Nepal | 89.0 /100 | #135 | Excellent $40,704 |
| Immigrants | Eastern Africa | 87.7 /100 | #136 | Excellent $40,644 |