Apache vs Immigrants from Laos Median Female Earnings
COMPARE
Apache
Immigrants from Laos
Median Female Earnings
Median Female Earnings Comparison
Apache
Immigrants from Laos
$34,895
MEDIAN FEMALE EARNINGS
0.0/ 100
METRIC RATING
314th/ 347
METRIC RANK
$36,841
MEDIAN FEMALE EARNINGS
0.3/ 100
METRIC RATING
273rd/ 347
METRIC RANK
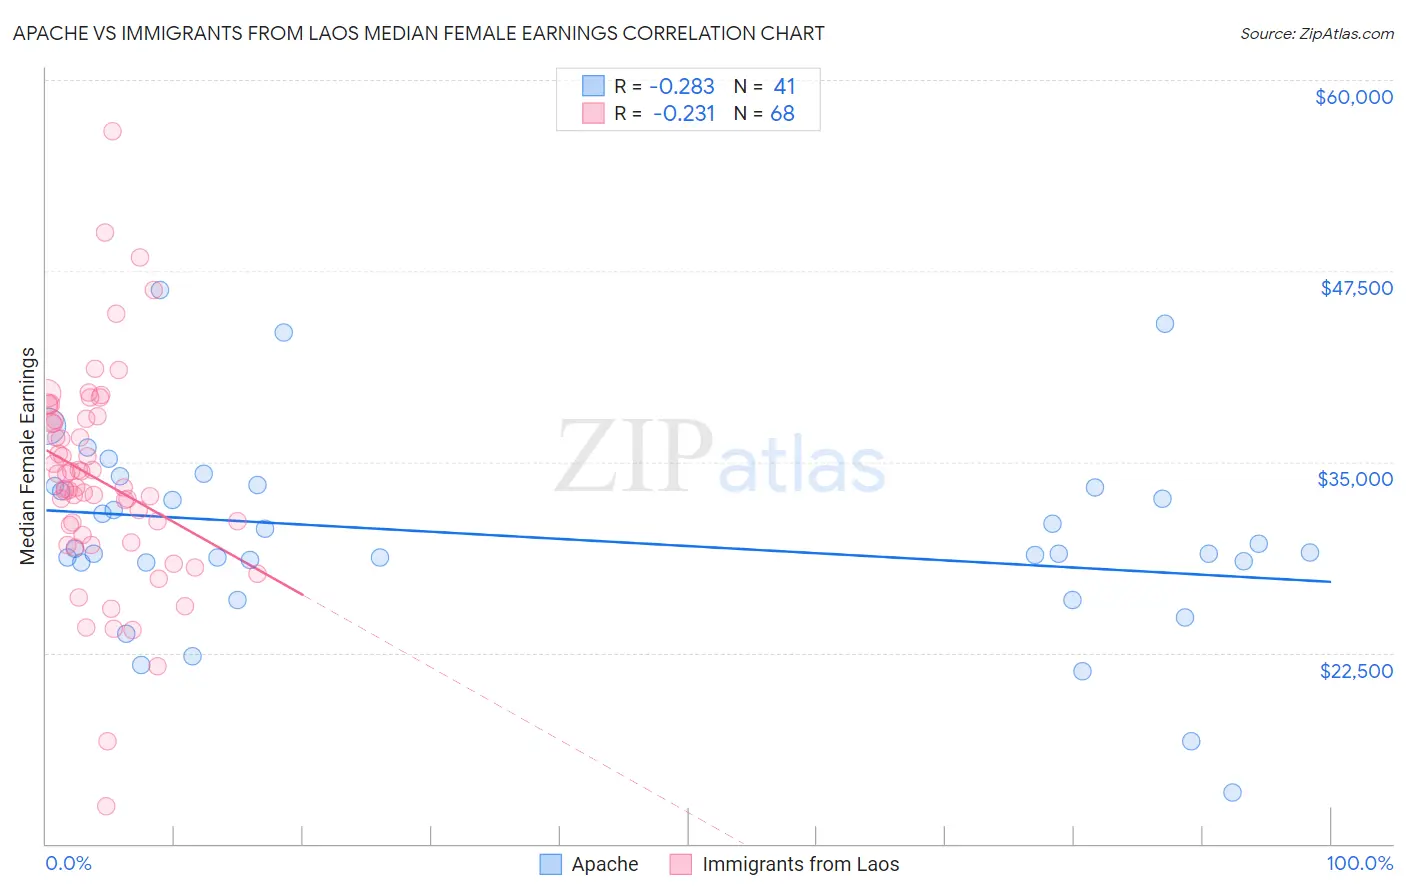
Apache vs Immigrants from Laos Median Female Earnings Correlation Chart
The statistical analysis conducted on geographies consisting of 230,997,872 people shows a weak negative correlation between the proportion of Apache and median female earnings in the United States with a correlation coefficient (R) of -0.283 and weighted average of $34,895. Similarly, the statistical analysis conducted on geographies consisting of 201,447,053 people shows a weak negative correlation between the proportion of Immigrants from Laos and median female earnings in the United States with a correlation coefficient (R) of -0.231 and weighted average of $36,841, a difference of 5.6%.
Median Female Earnings Correlation Summary
| Measurement | Apache | Immigrants from Laos |
| Minimum | $13,381 | $12,451 |
| Maximum | $46,250 | $56,635 |
| Range | $32,869 | $44,184 |
| Mean | $30,090 | $33,796 |
| Median | $29,044 | $33,308 |
| Interquartile 25% (IQ1) | $28,433 | $29,977 |
| Interquartile 75% (IQ3) | $33,369 | $37,781 |
| Interquartile Range (IQR) | $4,936 | $7,803 |
| Standard Deviation (Sample) | $6,387 | $7,087 |
| Standard Deviation (Population) | $6,309 | $7,035 |
Similar Demographics by Median Female Earnings
Demographics Similar to Apache by Median Female Earnings
In terms of median female earnings, the demographic groups most similar to Apache are Cuban ($34,942, a difference of 0.13%), Yaqui ($34,943, a difference of 0.14%), Ute ($34,960, a difference of 0.19%), Pennsylvania German ($34,802, a difference of 0.27%), and Chippewa ($35,003, a difference of 0.31%).
| Demographics | Rating | Rank | Median Female Earnings |
| Sioux | 0.0 /100 | #307 | Tragic $35,063 |
| Immigrants | Bahamas | 0.0 /100 | #308 | Tragic $35,027 |
| Hondurans | 0.0 /100 | #309 | Tragic $35,013 |
| Chippewa | 0.0 /100 | #310 | Tragic $35,003 |
| Ute | 0.0 /100 | #311 | Tragic $34,960 |
| Yaqui | 0.0 /100 | #312 | Tragic $34,943 |
| Cubans | 0.0 /100 | #313 | Tragic $34,942 |
| Apache | 0.0 /100 | #314 | Tragic $34,895 |
| Pennsylvania Germans | 0.0 /100 | #315 | Tragic $34,802 |
| Cherokee | 0.0 /100 | #316 | Tragic $34,742 |
| Potawatomi | 0.0 /100 | #317 | Tragic $34,739 |
| Immigrants | Yemen | 0.0 /100 | #318 | Tragic $34,693 |
| Shoshone | 0.0 /100 | #319 | Tragic $34,677 |
| Immigrants | Honduras | 0.0 /100 | #320 | Tragic $34,647 |
| Hispanics or Latinos | 0.0 /100 | #321 | Tragic $34,421 |
Demographics Similar to Immigrants from Laos by Median Female Earnings
In terms of median female earnings, the demographic groups most similar to Immigrants from Laos are Immigrants from Dominican Republic ($36,857, a difference of 0.040%), Nicaraguan ($36,904, a difference of 0.17%), French American Indian ($36,920, a difference of 0.21%), Immigrants from Venezuela ($37,003, a difference of 0.44%), and Immigrants from El Salvador ($36,673, a difference of 0.46%).
| Demographics | Rating | Rank | Median Female Earnings |
| Dominicans | 0.4 /100 | #266 | Tragic $37,046 |
| Immigrants | Nonimmigrants | 0.4 /100 | #267 | Tragic $37,024 |
| Cree | 0.4 /100 | #268 | Tragic $37,018 |
| Immigrants | Venezuela | 0.4 /100 | #269 | Tragic $37,003 |
| French American Indians | 0.3 /100 | #270 | Tragic $36,920 |
| Nicaraguans | 0.3 /100 | #271 | Tragic $36,904 |
| Immigrants | Dominican Republic | 0.3 /100 | #272 | Tragic $36,857 |
| Immigrants | Laos | 0.3 /100 | #273 | Tragic $36,841 |
| Immigrants | El Salvador | 0.2 /100 | #274 | Tragic $36,673 |
| Africans | 0.1 /100 | #275 | Tragic $36,530 |
| Central Americans | 0.1 /100 | #276 | Tragic $36,492 |
| Marshallese | 0.1 /100 | #277 | Tragic $36,459 |
| U.S. Virgin Islanders | 0.1 /100 | #278 | Tragic $36,424 |
| Immigrants | Caribbean | 0.1 /100 | #279 | Tragic $36,414 |
| Iroquois | 0.1 /100 | #280 | Tragic $36,408 |