Carpatho Rusyn vs Immigrants from Kenya Median Female Earnings
COMPARE
Carpatho Rusyn
Immigrants from Kenya
Median Female Earnings
Median Female Earnings Comparison
Carpatho Rusyns
Immigrants from Kenya
$40,825
MEDIAN FEMALE EARNINGS
91.2/ 100
METRIC RATING
128th/ 347
METRIC RANK
$39,535
MEDIAN FEMALE EARNINGS
41.6/ 100
METRIC RATING
180th/ 347
METRIC RANK
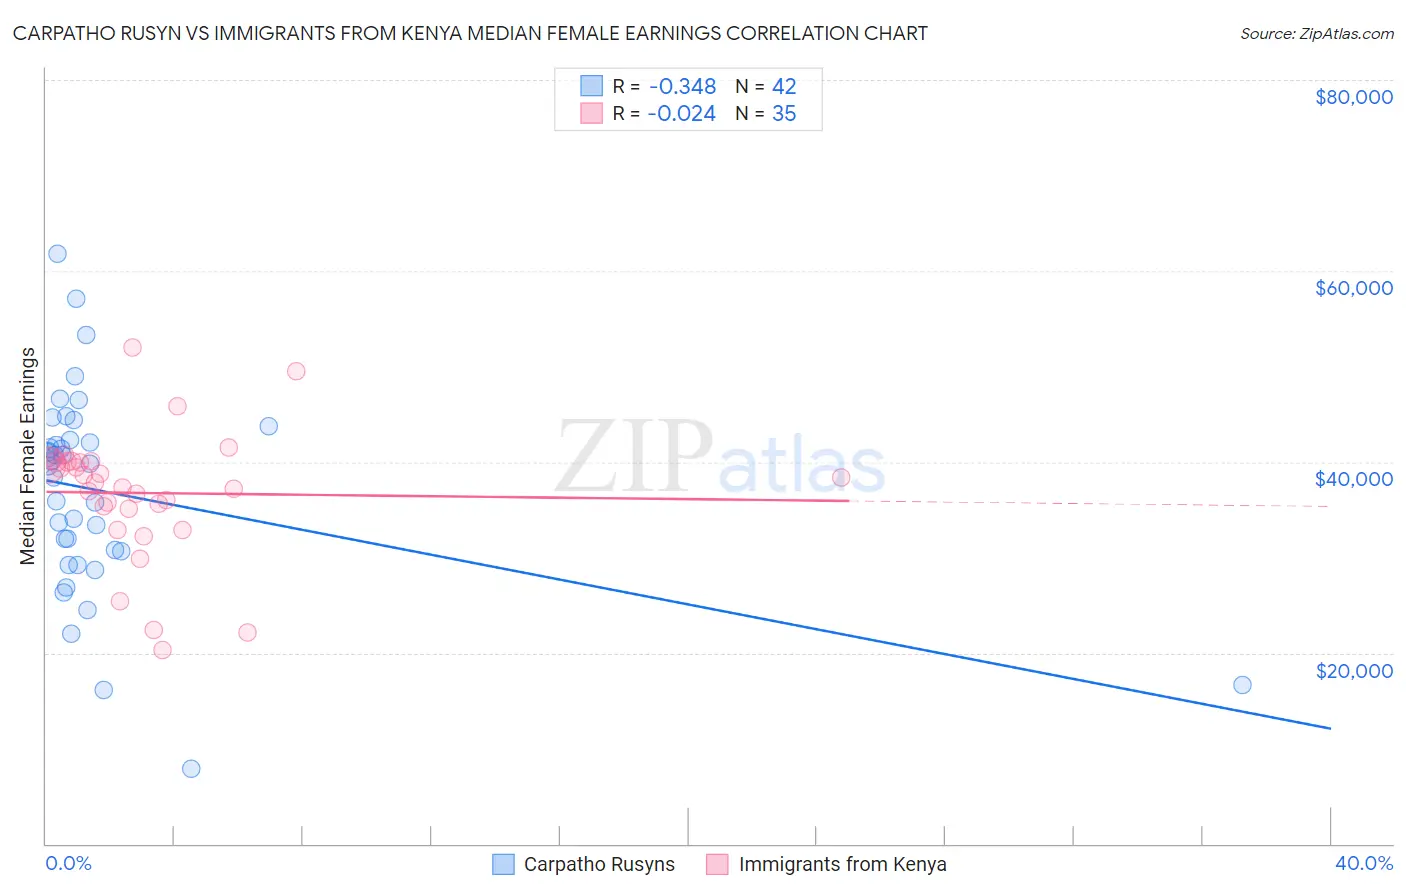
Carpatho Rusyn vs Immigrants from Kenya Median Female Earnings Correlation Chart
The statistical analysis conducted on geographies consisting of 58,866,706 people shows a mild negative correlation between the proportion of Carpatho Rusyns and median female earnings in the United States with a correlation coefficient (R) of -0.348 and weighted average of $40,825. Similarly, the statistical analysis conducted on geographies consisting of 218,064,981 people shows no correlation between the proportion of Immigrants from Kenya and median female earnings in the United States with a correlation coefficient (R) of -0.024 and weighted average of $39,535, a difference of 3.3%.
Median Female Earnings Correlation Summary
| Measurement | Carpatho Rusyn | Immigrants from Kenya |
| Minimum | $7,813 | $20,281 |
| Maximum | $61,814 | $51,989 |
| Range | $54,001 | $31,708 |
| Mean | $36,836 | $36,741 |
| Median | $39,667 | $37,816 |
| Interquartile 25% (IQ1) | $30,625 | $35,077 |
| Interquartile 75% (IQ3) | $42,321 | $40,014 |
| Interquartile Range (IQR) | $11,696 | $4,937 |
| Standard Deviation (Sample) | $10,700 | $6,740 |
| Standard Deviation (Population) | $10,572 | $6,643 |
Similar Demographics by Median Female Earnings
Demographics Similar to Carpatho Rusyns by Median Female Earnings
In terms of median female earnings, the demographic groups most similar to Carpatho Rusyns are Zimbabwean ($40,798, a difference of 0.070%), Immigrants from Guyana ($40,773, a difference of 0.13%), Ugandan ($40,889, a difference of 0.16%), Immigrants from Trinidad and Tobago ($40,895, a difference of 0.17%), and Chilean ($40,757, a difference of 0.17%).
| Demographics | Rating | Rank | Median Female Earnings |
| Croatians | 93.7 /100 | #121 | Exceptional $40,993 |
| Immigrants | Jordan | 93.5 /100 | #122 | Exceptional $40,977 |
| Guyanese | 93.4 /100 | #123 | Exceptional $40,973 |
| Trinidadians and Tobagonians | 93.2 /100 | #124 | Exceptional $40,958 |
| Austrians | 92.7 /100 | #125 | Exceptional $40,923 |
| Immigrants | Trinidad and Tobago | 92.3 /100 | #126 | Exceptional $40,895 |
| Ugandans | 92.2 /100 | #127 | Exceptional $40,889 |
| Carpatho Rusyns | 91.2 /100 | #128 | Exceptional $40,825 |
| Zimbabweans | 90.8 /100 | #129 | Exceptional $40,798 |
| Immigrants | Guyana | 90.3 /100 | #130 | Exceptional $40,773 |
| Chileans | 90.0 /100 | #131 | Exceptional $40,757 |
| Immigrants | Uganda | 89.7 /100 | #132 | Excellent $40,739 |
| Syrians | 89.5 /100 | #133 | Excellent $40,727 |
| Arabs | 89.3 /100 | #134 | Excellent $40,718 |
| Immigrants | Nepal | 89.0 /100 | #135 | Excellent $40,704 |
Demographics Similar to Immigrants from Kenya by Median Female Earnings
In terms of median female earnings, the demographic groups most similar to Immigrants from Kenya are Tsimshian ($39,530, a difference of 0.010%), Tlingit-Haida ($39,513, a difference of 0.060%), Hungarian ($39,510, a difference of 0.060%), Immigrants from Germany ($39,603, a difference of 0.17%), and Slavic ($39,613, a difference of 0.20%).
| Demographics | Rating | Rank | Median Female Earnings |
| Canadians | 51.4 /100 | #173 | Average $39,724 |
| South Americans | 50.0 /100 | #174 | Average $39,698 |
| Immigrants | South America | 47.2 /100 | #175 | Average $39,643 |
| Nigerians | 47.0 /100 | #176 | Average $39,641 |
| Costa Ricans | 46.1 /100 | #177 | Average $39,622 |
| Slavs | 45.6 /100 | #178 | Average $39,613 |
| Immigrants | Germany | 45.1 /100 | #179 | Average $39,603 |
| Immigrants | Kenya | 41.6 /100 | #180 | Average $39,535 |
| Tsimshian | 41.4 /100 | #181 | Average $39,530 |
| Tlingit-Haida | 40.5 /100 | #182 | Average $39,513 |
| Hungarians | 40.3 /100 | #183 | Average $39,510 |
| Europeans | 37.7 /100 | #184 | Fair $39,457 |
| Immigrants | West Indies | 36.9 /100 | #185 | Fair $39,441 |
| Colombians | 36.9 /100 | #186 | Fair $39,439 |
| Swedes | 36.0 /100 | #187 | Fair $39,421 |