Apache vs Immigrants from Iran Median Female Earnings
COMPARE
Apache
Immigrants from Iran
Median Female Earnings
Median Female Earnings Comparison
Apache
Immigrants from Iran
$34,895
MEDIAN FEMALE EARNINGS
0.0/ 100
METRIC RATING
314th/ 347
METRIC RANK
$47,154
MEDIAN FEMALE EARNINGS
100.0/ 100
METRIC RATING
9th/ 347
METRIC RANK
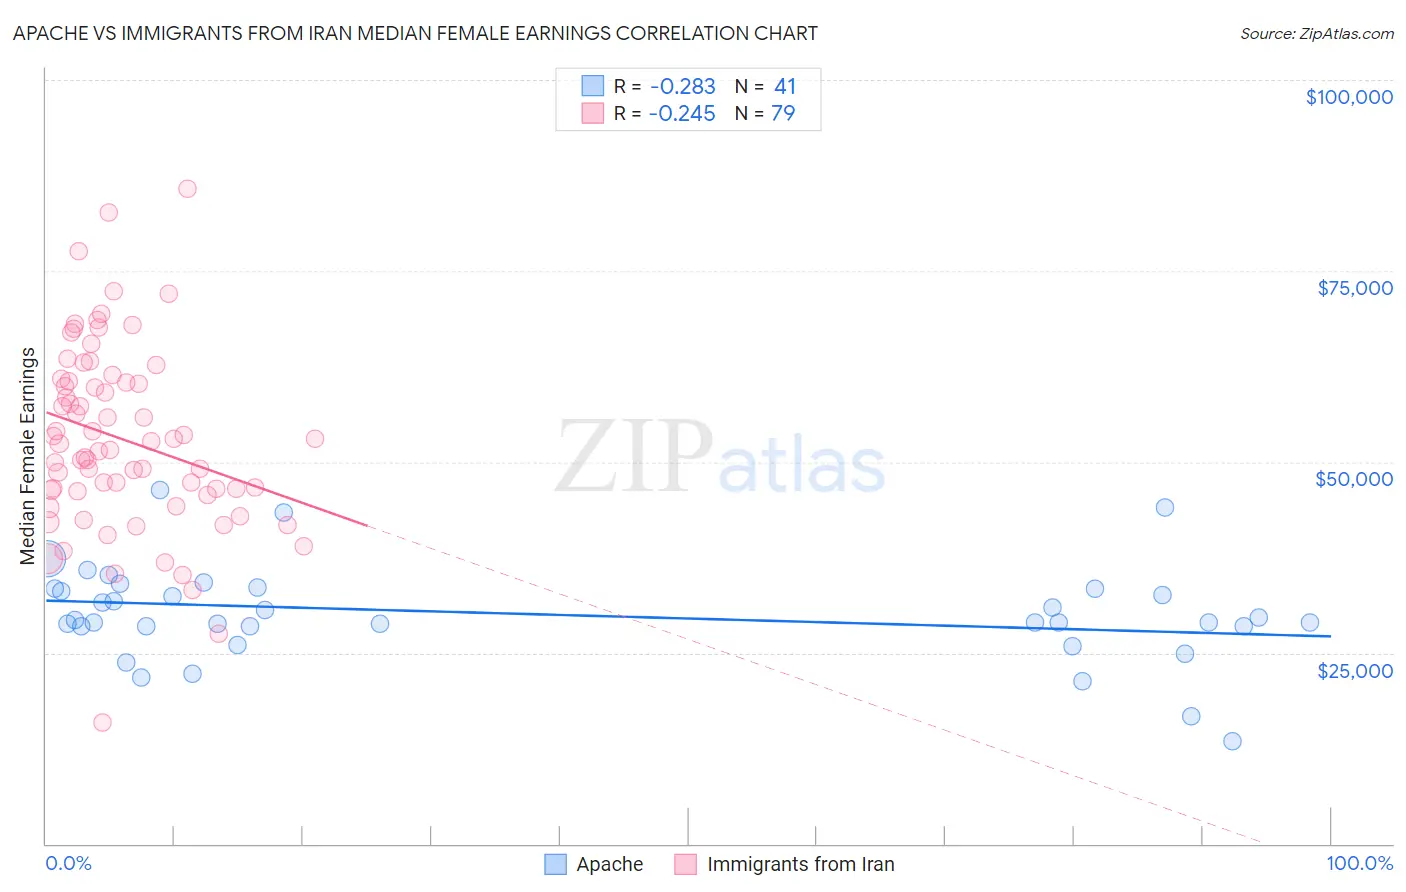
Apache vs Immigrants from Iran Median Female Earnings Correlation Chart
The statistical analysis conducted on geographies consisting of 230,997,872 people shows a weak negative correlation between the proportion of Apache and median female earnings in the United States with a correlation coefficient (R) of -0.283 and weighted average of $34,895. Similarly, the statistical analysis conducted on geographies consisting of 279,791,483 people shows a weak negative correlation between the proportion of Immigrants from Iran and median female earnings in the United States with a correlation coefficient (R) of -0.245 and weighted average of $47,154, a difference of 35.1%.
Median Female Earnings Correlation Summary
| Measurement | Apache | Immigrants from Iran |
| Minimum | $13,381 | $15,864 |
| Maximum | $46,250 | $85,822 |
| Range | $32,869 | $69,958 |
| Mean | $30,090 | $52,976 |
| Median | $29,044 | $52,367 |
| Interquartile 25% (IQ1) | $28,433 | $46,131 |
| Interquartile 75% (IQ3) | $33,369 | $60,507 |
| Interquartile Range (IQR) | $4,936 | $14,376 |
| Standard Deviation (Sample) | $6,387 | $12,151 |
| Standard Deviation (Population) | $6,309 | $12,074 |
Similar Demographics by Median Female Earnings
Demographics Similar to Apache by Median Female Earnings
In terms of median female earnings, the demographic groups most similar to Apache are Cuban ($34,942, a difference of 0.13%), Yaqui ($34,943, a difference of 0.14%), Ute ($34,960, a difference of 0.19%), Pennsylvania German ($34,802, a difference of 0.27%), and Chippewa ($35,003, a difference of 0.31%).
| Demographics | Rating | Rank | Median Female Earnings |
| Sioux | 0.0 /100 | #307 | Tragic $35,063 |
| Immigrants | Bahamas | 0.0 /100 | #308 | Tragic $35,027 |
| Hondurans | 0.0 /100 | #309 | Tragic $35,013 |
| Chippewa | 0.0 /100 | #310 | Tragic $35,003 |
| Ute | 0.0 /100 | #311 | Tragic $34,960 |
| Yaqui | 0.0 /100 | #312 | Tragic $34,943 |
| Cubans | 0.0 /100 | #313 | Tragic $34,942 |
| Apache | 0.0 /100 | #314 | Tragic $34,895 |
| Pennsylvania Germans | 0.0 /100 | #315 | Tragic $34,802 |
| Cherokee | 0.0 /100 | #316 | Tragic $34,742 |
| Potawatomi | 0.0 /100 | #317 | Tragic $34,739 |
| Immigrants | Yemen | 0.0 /100 | #318 | Tragic $34,693 |
| Shoshone | 0.0 /100 | #319 | Tragic $34,677 |
| Immigrants | Honduras | 0.0 /100 | #320 | Tragic $34,647 |
| Hispanics or Latinos | 0.0 /100 | #321 | Tragic $34,421 |
Demographics Similar to Immigrants from Iran by Median Female Earnings
In terms of median female earnings, the demographic groups most similar to Immigrants from Iran are Immigrants from China ($46,972, a difference of 0.39%), Okinawan ($46,905, a difference of 0.53%), Immigrants from Israel ($46,902, a difference of 0.54%), Iranian ($47,421, a difference of 0.57%), and Thai ($47,577, a difference of 0.90%).
| Demographics | Rating | Rank | Median Female Earnings |
| Filipinos | 100.0 /100 | #2 | Exceptional $49,508 |
| Immigrants | Taiwan | 100.0 /100 | #3 | Exceptional $49,256 |
| Immigrants | India | 100.0 /100 | #4 | Exceptional $48,292 |
| Immigrants | Singapore | 100.0 /100 | #5 | Exceptional $47,986 |
| Immigrants | Ireland | 100.0 /100 | #6 | Exceptional $47,598 |
| Thais | 100.0 /100 | #7 | Exceptional $47,577 |
| Iranians | 100.0 /100 | #8 | Exceptional $47,421 |
| Immigrants | Iran | 100.0 /100 | #9 | Exceptional $47,154 |
| Immigrants | China | 100.0 /100 | #10 | Exceptional $46,972 |
| Okinawans | 100.0 /100 | #11 | Exceptional $46,905 |
| Immigrants | Israel | 100.0 /100 | #12 | Exceptional $46,902 |
| Immigrants | Australia | 100.0 /100 | #13 | Exceptional $46,573 |
| Soviet Union | 100.0 /100 | #14 | Exceptional $46,556 |
| Immigrants | Eastern Asia | 100.0 /100 | #15 | Exceptional $46,502 |
| Indians (Asian) | 100.0 /100 | #16 | Exceptional $46,481 |