Palestinian vs Immigrants from Kenya Median Female Earnings
COMPARE
Palestinian
Immigrants from Kenya
Median Female Earnings
Median Female Earnings Comparison
Palestinians
Immigrants from Kenya
$41,484
MEDIAN FEMALE EARNINGS
97.6/ 100
METRIC RATING
107th/ 347
METRIC RANK
$39,535
MEDIAN FEMALE EARNINGS
41.6/ 100
METRIC RATING
180th/ 347
METRIC RANK
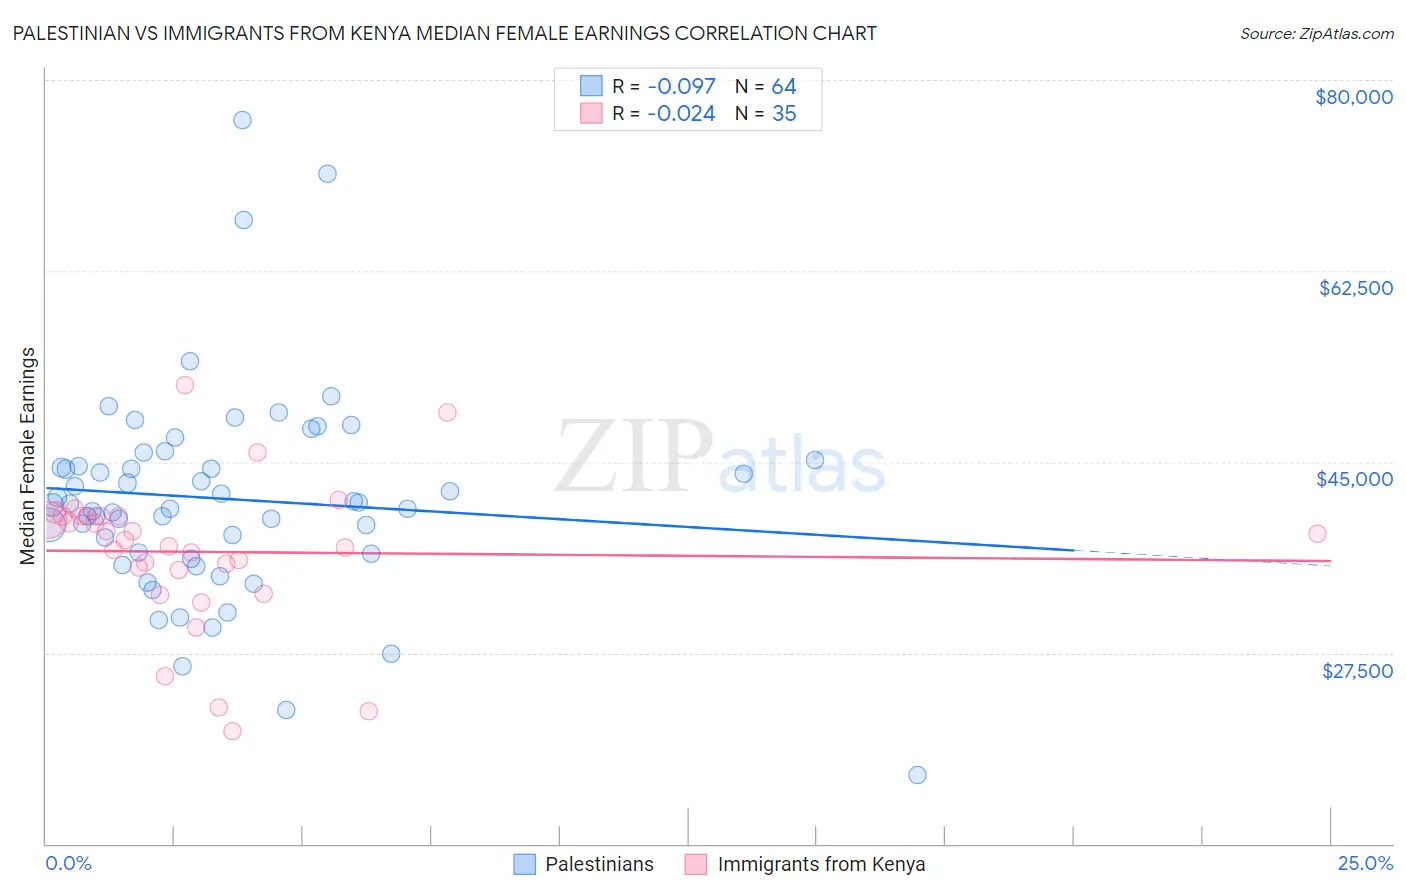
Palestinian vs Immigrants from Kenya Median Female Earnings Correlation Chart
The statistical analysis conducted on geographies consisting of 216,451,801 people shows a slight negative correlation between the proportion of Palestinians and median female earnings in the United States with a correlation coefficient (R) of -0.097 and weighted average of $41,484. Similarly, the statistical analysis conducted on geographies consisting of 218,064,981 people shows no correlation between the proportion of Immigrants from Kenya and median female earnings in the United States with a correlation coefficient (R) of -0.024 and weighted average of $39,535, a difference of 4.9%.
Median Female Earnings Correlation Summary
| Measurement | Palestinian | Immigrants from Kenya |
| Minimum | $16,250 | $20,281 |
| Maximum | $76,295 | $51,989 |
| Range | $60,045 | $31,708 |
| Mean | $41,606 | $36,741 |
| Median | $41,078 | $37,816 |
| Interquartile 25% (IQ1) | $36,652 | $35,077 |
| Interquartile 75% (IQ3) | $44,886 | $40,014 |
| Interquartile Range (IQR) | $8,234 | $4,937 |
| Standard Deviation (Sample) | $9,677 | $6,740 |
| Standard Deviation (Population) | $9,602 | $6,643 |
Similar Demographics by Median Female Earnings
Demographics Similar to Palestinians by Median Female Earnings
In terms of median female earnings, the demographic groups most similar to Palestinians are Immigrants from Eritrea ($41,485, a difference of 0.0%), Italian ($41,505, a difference of 0.050%), Jordanian ($41,464, a difference of 0.050%), Chinese ($41,461, a difference of 0.050%), and Immigrants from Zimbabwe ($41,527, a difference of 0.10%).
| Demographics | Rating | Rank | Median Female Earnings |
| Romanians | 98.3 /100 | #100 | Exceptional $41,663 |
| Immigrants | Fiji | 98.3 /100 | #101 | Exceptional $41,656 |
| Immigrants | Poland | 98.2 /100 | #102 | Exceptional $41,630 |
| Immigrants | Argentina | 97.9 /100 | #103 | Exceptional $41,554 |
| Immigrants | Zimbabwe | 97.8 /100 | #104 | Exceptional $41,527 |
| Italians | 97.7 /100 | #105 | Exceptional $41,505 |
| Immigrants | Eritrea | 97.6 /100 | #106 | Exceptional $41,485 |
| Palestinians | 97.6 /100 | #107 | Exceptional $41,484 |
| Jordanians | 97.5 /100 | #108 | Exceptional $41,464 |
| Chinese | 97.5 /100 | #109 | Exceptional $41,461 |
| Immigrants | Western Asia | 97.0 /100 | #110 | Exceptional $41,375 |
| Immigrants | Canada | 97.0 /100 | #111 | Exceptional $41,373 |
| Immigrants | North America | 96.7 /100 | #112 | Exceptional $41,319 |
| Macedonians | 96.4 /100 | #113 | Exceptional $41,286 |
| Immigrants | England | 96.4 /100 | #114 | Exceptional $41,277 |
Demographics Similar to Immigrants from Kenya by Median Female Earnings
In terms of median female earnings, the demographic groups most similar to Immigrants from Kenya are Tsimshian ($39,530, a difference of 0.010%), Tlingit-Haida ($39,513, a difference of 0.060%), Hungarian ($39,510, a difference of 0.060%), Immigrants from Germany ($39,603, a difference of 0.17%), and Slavic ($39,613, a difference of 0.20%).
| Demographics | Rating | Rank | Median Female Earnings |
| Canadians | 51.4 /100 | #173 | Average $39,724 |
| South Americans | 50.0 /100 | #174 | Average $39,698 |
| Immigrants | South America | 47.2 /100 | #175 | Average $39,643 |
| Nigerians | 47.0 /100 | #176 | Average $39,641 |
| Costa Ricans | 46.1 /100 | #177 | Average $39,622 |
| Slavs | 45.6 /100 | #178 | Average $39,613 |
| Immigrants | Germany | 45.1 /100 | #179 | Average $39,603 |
| Immigrants | Kenya | 41.6 /100 | #180 | Average $39,535 |
| Tsimshian | 41.4 /100 | #181 | Average $39,530 |
| Tlingit-Haida | 40.5 /100 | #182 | Average $39,513 |
| Hungarians | 40.3 /100 | #183 | Average $39,510 |
| Europeans | 37.7 /100 | #184 | Fair $39,457 |
| Immigrants | West Indies | 36.9 /100 | #185 | Fair $39,441 |
| Colombians | 36.9 /100 | #186 | Fair $39,439 |
| Swedes | 36.0 /100 | #187 | Fair $39,421 |