Apache vs Immigrants from Portugal Median Female Earnings
COMPARE
Apache
Immigrants from Portugal
Median Female Earnings
Median Female Earnings Comparison
Apache
Immigrants from Portugal
$34,895
MEDIAN FEMALE EARNINGS
0.0/ 100
METRIC RATING
314th/ 347
METRIC RANK
$39,788
MEDIAN FEMALE EARNINGS
54.7/ 100
METRIC RATING
171st/ 347
METRIC RANK
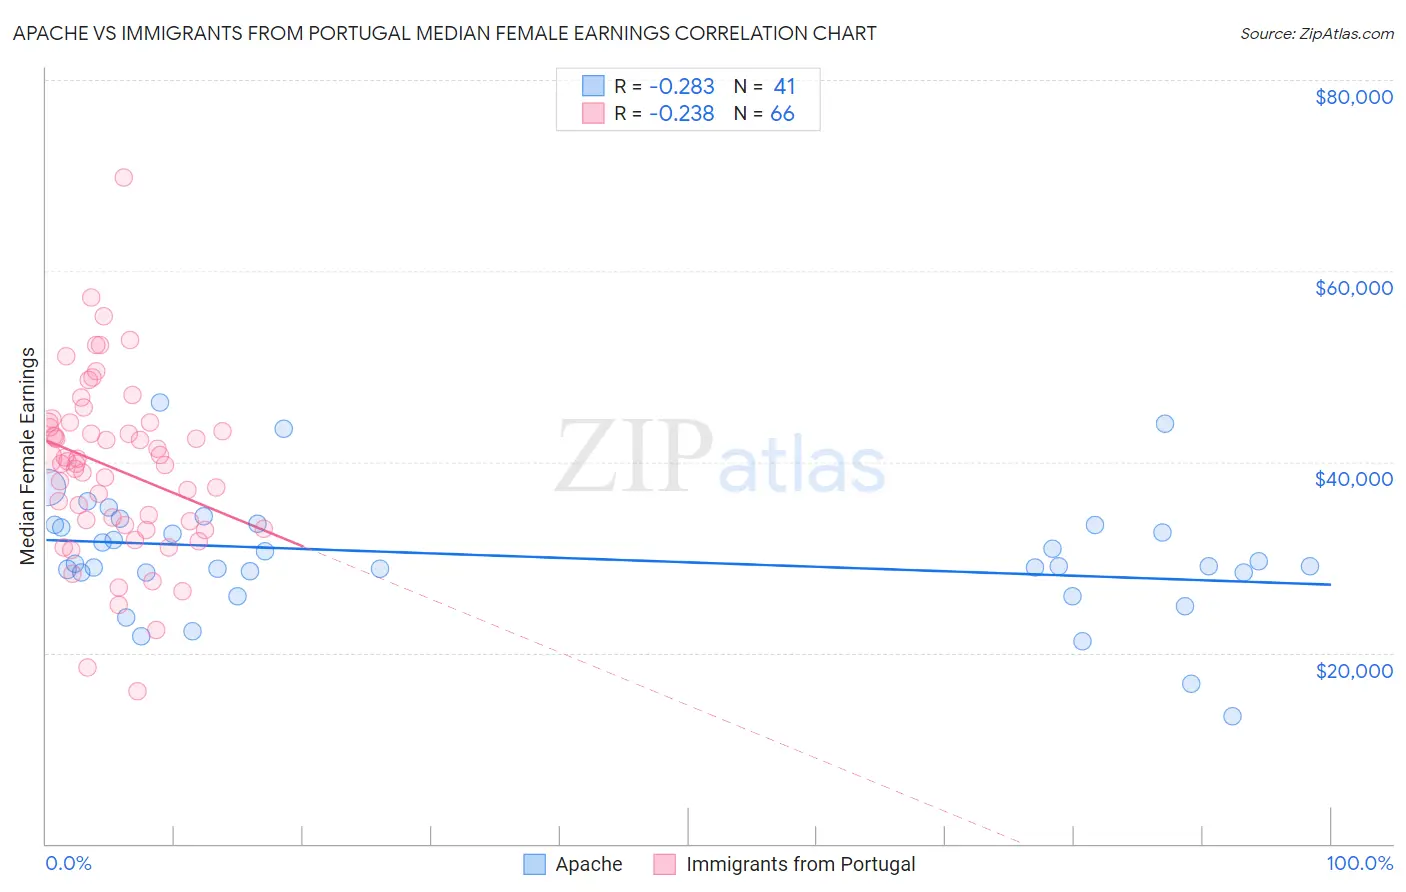
Apache vs Immigrants from Portugal Median Female Earnings Correlation Chart
The statistical analysis conducted on geographies consisting of 230,997,872 people shows a weak negative correlation between the proportion of Apache and median female earnings in the United States with a correlation coefficient (R) of -0.283 and weighted average of $34,895. Similarly, the statistical analysis conducted on geographies consisting of 174,753,972 people shows a weak negative correlation between the proportion of Immigrants from Portugal and median female earnings in the United States with a correlation coefficient (R) of -0.238 and weighted average of $39,788, a difference of 14.0%.
Median Female Earnings Correlation Summary
| Measurement | Apache | Immigrants from Portugal |
| Minimum | $13,381 | $15,996 |
| Maximum | $46,250 | $69,732 |
| Range | $32,869 | $53,736 |
| Mean | $30,090 | $39,346 |
| Median | $29,044 | $39,980 |
| Interquartile 25% (IQ1) | $28,433 | $33,451 |
| Interquartile 75% (IQ3) | $33,369 | $44,115 |
| Interquartile Range (IQR) | $4,936 | $10,664 |
| Standard Deviation (Sample) | $6,387 | $9,199 |
| Standard Deviation (Population) | $6,309 | $9,130 |
Similar Demographics by Median Female Earnings
Demographics Similar to Apache by Median Female Earnings
In terms of median female earnings, the demographic groups most similar to Apache are Cuban ($34,942, a difference of 0.13%), Yaqui ($34,943, a difference of 0.14%), Ute ($34,960, a difference of 0.19%), Pennsylvania German ($34,802, a difference of 0.27%), and Chippewa ($35,003, a difference of 0.31%).
| Demographics | Rating | Rank | Median Female Earnings |
| Sioux | 0.0 /100 | #307 | Tragic $35,063 |
| Immigrants | Bahamas | 0.0 /100 | #308 | Tragic $35,027 |
| Hondurans | 0.0 /100 | #309 | Tragic $35,013 |
| Chippewa | 0.0 /100 | #310 | Tragic $35,003 |
| Ute | 0.0 /100 | #311 | Tragic $34,960 |
| Yaqui | 0.0 /100 | #312 | Tragic $34,943 |
| Cubans | 0.0 /100 | #313 | Tragic $34,942 |
| Apache | 0.0 /100 | #314 | Tragic $34,895 |
| Pennsylvania Germans | 0.0 /100 | #315 | Tragic $34,802 |
| Cherokee | 0.0 /100 | #316 | Tragic $34,742 |
| Potawatomi | 0.0 /100 | #317 | Tragic $34,739 |
| Immigrants | Yemen | 0.0 /100 | #318 | Tragic $34,693 |
| Shoshone | 0.0 /100 | #319 | Tragic $34,677 |
| Immigrants | Honduras | 0.0 /100 | #320 | Tragic $34,647 |
| Hispanics or Latinos | 0.0 /100 | #321 | Tragic $34,421 |
Demographics Similar to Immigrants from Portugal by Median Female Earnings
In terms of median female earnings, the demographic groups most similar to Immigrants from Portugal are British ($39,772, a difference of 0.040%), Slovene ($39,817, a difference of 0.070%), Canadian ($39,724, a difference of 0.16%), Kenyan ($39,860, a difference of 0.18%), and Immigrants from Peru ($39,871, a difference of 0.21%).
| Demographics | Rating | Rank | Median Female Earnings |
| Immigrants | Saudi Arabia | 62.9 /100 | #164 | Good $39,952 |
| Immigrants | Bangladesh | 60.8 /100 | #165 | Good $39,910 |
| Immigrants | Ghana | 60.0 /100 | #166 | Good $39,894 |
| Luxembourgers | 59.9 /100 | #167 | Average $39,891 |
| Immigrants | Peru | 58.9 /100 | #168 | Average $39,871 |
| Kenyans | 58.4 /100 | #169 | Average $39,860 |
| Slovenes | 56.2 /100 | #170 | Average $39,817 |
| Immigrants | Portugal | 54.7 /100 | #171 | Average $39,788 |
| British | 53.8 /100 | #172 | Average $39,772 |
| Canadians | 51.4 /100 | #173 | Average $39,724 |
| South Americans | 50.0 /100 | #174 | Average $39,698 |
| Immigrants | South America | 47.2 /100 | #175 | Average $39,643 |
| Nigerians | 47.0 /100 | #176 | Average $39,641 |
| Costa Ricans | 46.1 /100 | #177 | Average $39,622 |
| Slavs | 45.6 /100 | #178 | Average $39,613 |