Apache vs Immigrants from Sierra Leone Median Female Earnings
COMPARE
Apache
Immigrants from Sierra Leone
Median Female Earnings
Median Female Earnings Comparison
Apache
Immigrants from Sierra Leone
$34,895
MEDIAN FEMALE EARNINGS
0.0/ 100
METRIC RATING
314th/ 347
METRIC RANK
$42,214
MEDIAN FEMALE EARNINGS
99.5/ 100
METRIC RATING
83rd/ 347
METRIC RANK
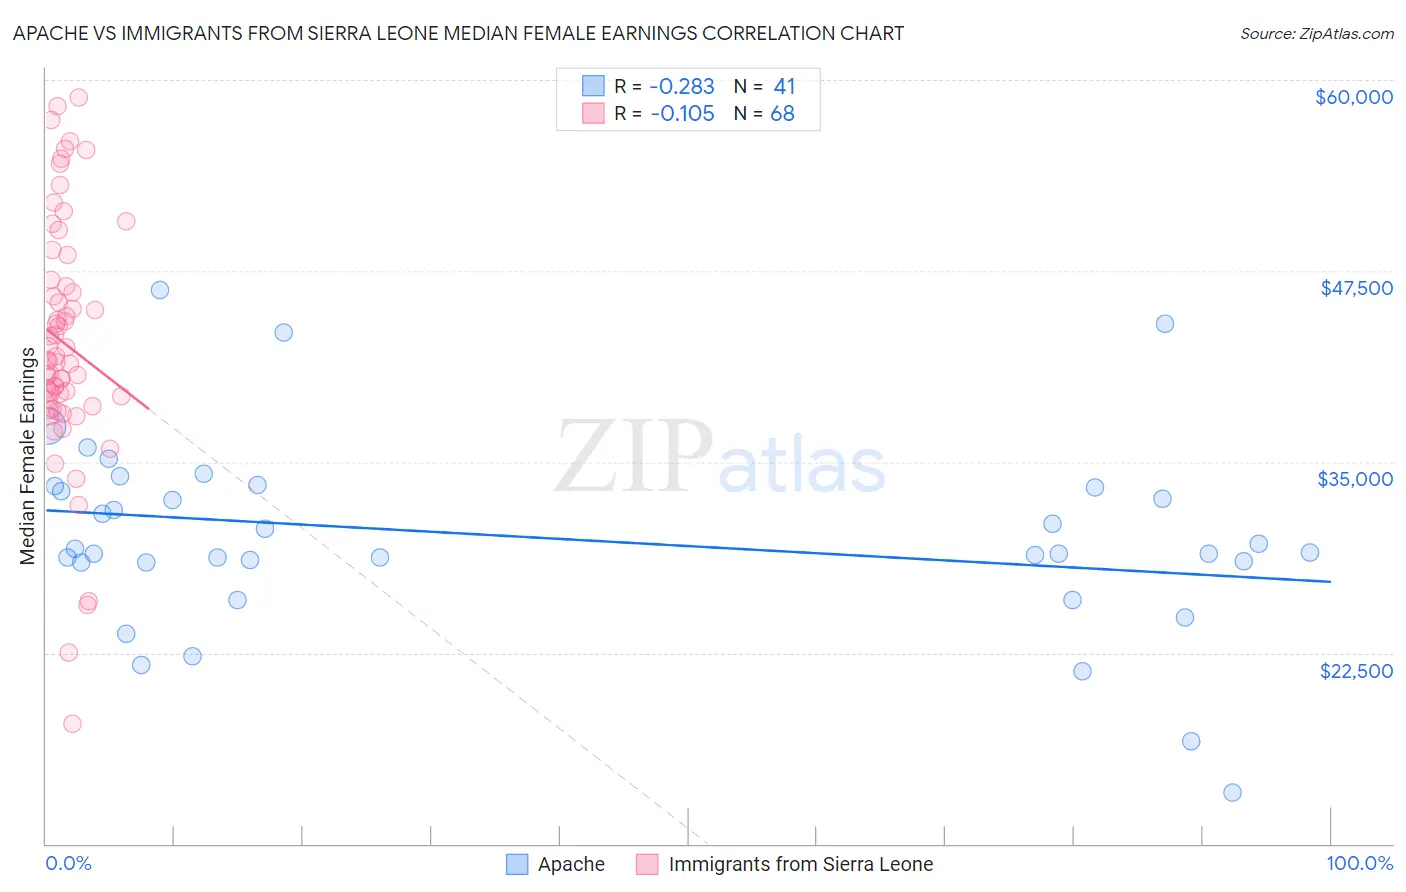
Apache vs Immigrants from Sierra Leone Median Female Earnings Correlation Chart
The statistical analysis conducted on geographies consisting of 230,997,872 people shows a weak negative correlation between the proportion of Apache and median female earnings in the United States with a correlation coefficient (R) of -0.283 and weighted average of $34,895. Similarly, the statistical analysis conducted on geographies consisting of 101,627,832 people shows a poor negative correlation between the proportion of Immigrants from Sierra Leone and median female earnings in the United States with a correlation coefficient (R) of -0.105 and weighted average of $42,214, a difference of 21.0%.
Median Female Earnings Correlation Summary
| Measurement | Apache | Immigrants from Sierra Leone |
| Minimum | $13,381 | $17,869 |
| Maximum | $46,250 | $58,839 |
| Range | $32,869 | $40,970 |
| Mean | $30,090 | $42,763 |
| Median | $29,044 | $41,611 |
| Interquartile 25% (IQ1) | $28,433 | $38,837 |
| Interquartile 75% (IQ3) | $33,369 | $46,686 |
| Interquartile Range (IQR) | $4,936 | $7,849 |
| Standard Deviation (Sample) | $6,387 | $8,036 |
| Standard Deviation (Population) | $6,309 | $7,977 |
Similar Demographics by Median Female Earnings
Demographics Similar to Apache by Median Female Earnings
In terms of median female earnings, the demographic groups most similar to Apache are Cuban ($34,942, a difference of 0.13%), Yaqui ($34,943, a difference of 0.14%), Ute ($34,960, a difference of 0.19%), Pennsylvania German ($34,802, a difference of 0.27%), and Chippewa ($35,003, a difference of 0.31%).
| Demographics | Rating | Rank | Median Female Earnings |
| Sioux | 0.0 /100 | #307 | Tragic $35,063 |
| Immigrants | Bahamas | 0.0 /100 | #308 | Tragic $35,027 |
| Hondurans | 0.0 /100 | #309 | Tragic $35,013 |
| Chippewa | 0.0 /100 | #310 | Tragic $35,003 |
| Ute | 0.0 /100 | #311 | Tragic $34,960 |
| Yaqui | 0.0 /100 | #312 | Tragic $34,943 |
| Cubans | 0.0 /100 | #313 | Tragic $34,942 |
| Apache | 0.0 /100 | #314 | Tragic $34,895 |
| Pennsylvania Germans | 0.0 /100 | #315 | Tragic $34,802 |
| Cherokee | 0.0 /100 | #316 | Tragic $34,742 |
| Potawatomi | 0.0 /100 | #317 | Tragic $34,739 |
| Immigrants | Yemen | 0.0 /100 | #318 | Tragic $34,693 |
| Shoshone | 0.0 /100 | #319 | Tragic $34,677 |
| Immigrants | Honduras | 0.0 /100 | #320 | Tragic $34,647 |
| Hispanics or Latinos | 0.0 /100 | #321 | Tragic $34,421 |
Demographics Similar to Immigrants from Sierra Leone by Median Female Earnings
In terms of median female earnings, the demographic groups most similar to Immigrants from Sierra Leone are Armenian ($42,212, a difference of 0.010%), Immigrants from Morocco ($42,229, a difference of 0.030%), Immigrants from Southern Europe ($42,275, a difference of 0.14%), Laotian ($42,133, a difference of 0.19%), and Immigrants from Moldova ($42,304, a difference of 0.21%).
| Demographics | Rating | Rank | Median Female Earnings |
| Immigrants | Italy | 99.7 /100 | #76 | Exceptional $42,446 |
| Immigrants | Albania | 99.6 /100 | #77 | Exceptional $42,388 |
| Immigrants | Kazakhstan | 99.6 /100 | #78 | Exceptional $42,386 |
| Greeks | 99.6 /100 | #79 | Exceptional $42,336 |
| Immigrants | Moldova | 99.6 /100 | #80 | Exceptional $42,304 |
| Immigrants | Southern Europe | 99.5 /100 | #81 | Exceptional $42,275 |
| Immigrants | Morocco | 99.5 /100 | #82 | Exceptional $42,229 |
| Immigrants | Sierra Leone | 99.5 /100 | #83 | Exceptional $42,214 |
| Armenians | 99.5 /100 | #84 | Exceptional $42,212 |
| Laotians | 99.4 /100 | #85 | Exceptional $42,133 |
| Immigrants | St. Vincent and the Grenadines | 99.3 /100 | #86 | Exceptional $42,108 |
| Lithuanians | 99.3 /100 | #87 | Exceptional $42,108 |
| Immigrants | Northern Africa | 99.3 /100 | #88 | Exceptional $42,084 |
| Immigrants | Afghanistan | 99.3 /100 | #89 | Exceptional $42,055 |
| Ukrainians | 99.2 /100 | #90 | Exceptional $42,015 |