Apache vs Immigrants from Philippines Median Female Earnings
COMPARE
Apache
Immigrants from Philippines
Median Female Earnings
Median Female Earnings Comparison
Apache
Immigrants from Philippines
$34,895
MEDIAN FEMALE EARNINGS
0.0/ 100
METRIC RATING
314th/ 347
METRIC RANK
$41,114
MEDIAN FEMALE EARNINGS
95.0/ 100
METRIC RATING
119th/ 347
METRIC RANK
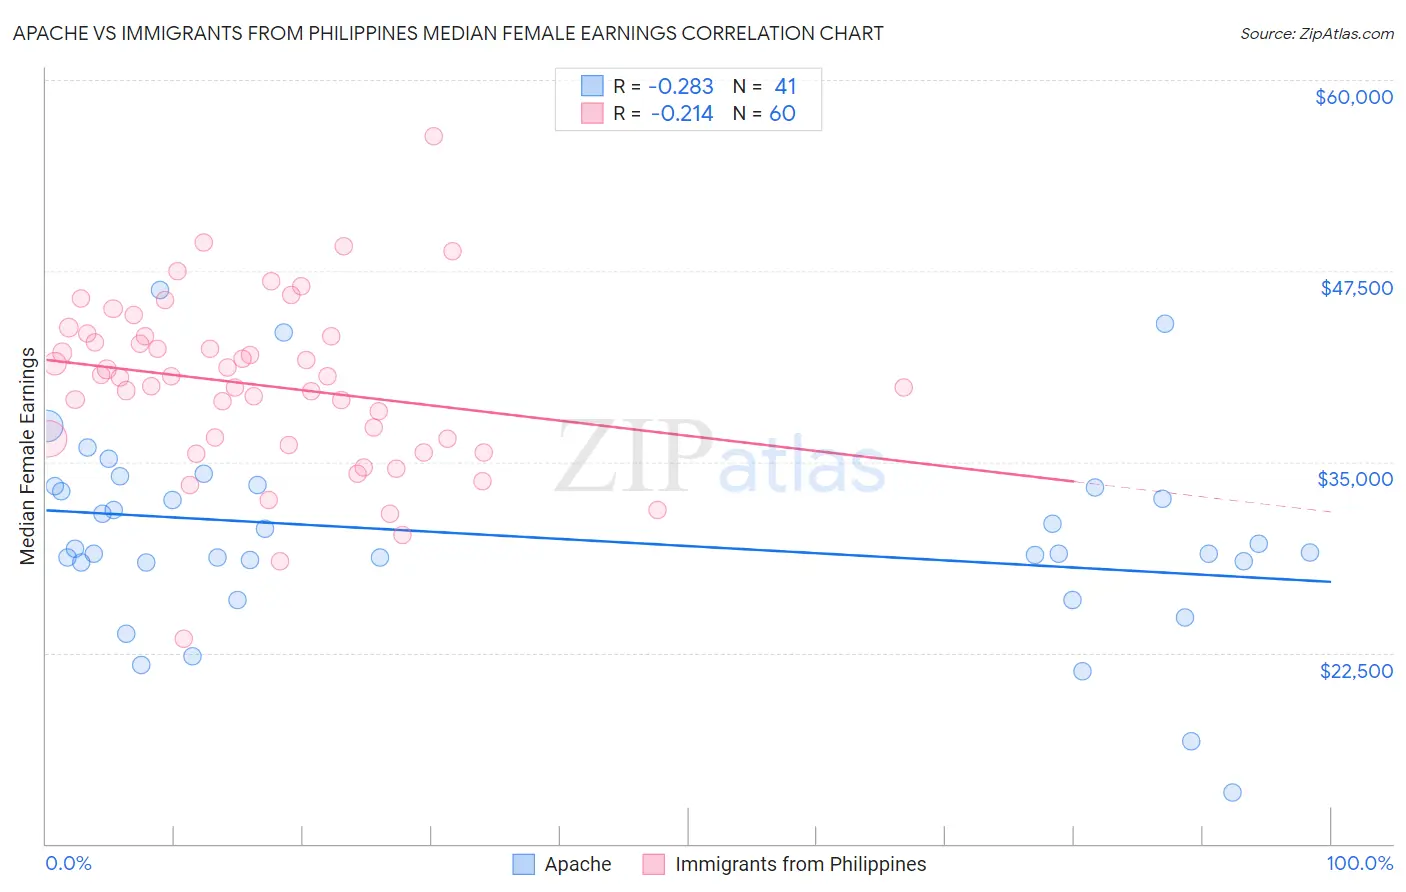
Apache vs Immigrants from Philippines Median Female Earnings Correlation Chart
The statistical analysis conducted on geographies consisting of 230,997,872 people shows a weak negative correlation between the proportion of Apache and median female earnings in the United States with a correlation coefficient (R) of -0.283 and weighted average of $34,895. Similarly, the statistical analysis conducted on geographies consisting of 470,999,138 people shows a weak negative correlation between the proportion of Immigrants from Philippines and median female earnings in the United States with a correlation coefficient (R) of -0.214 and weighted average of $41,114, a difference of 17.8%.
Median Female Earnings Correlation Summary
| Measurement | Apache | Immigrants from Philippines |
| Minimum | $13,381 | $23,405 |
| Maximum | $46,250 | $56,354 |
| Range | $32,869 | $32,949 |
| Mean | $30,090 | $40,018 |
| Median | $29,044 | $40,572 |
| Interquartile 25% (IQ1) | $28,433 | $36,304 |
| Interquartile 75% (IQ3) | $33,369 | $43,216 |
| Interquartile Range (IQR) | $4,936 | $6,912 |
| Standard Deviation (Sample) | $6,387 | $5,659 |
| Standard Deviation (Population) | $6,309 | $5,612 |
Similar Demographics by Median Female Earnings
Demographics Similar to Apache by Median Female Earnings
In terms of median female earnings, the demographic groups most similar to Apache are Cuban ($34,942, a difference of 0.13%), Yaqui ($34,943, a difference of 0.14%), Ute ($34,960, a difference of 0.19%), Pennsylvania German ($34,802, a difference of 0.27%), and Chippewa ($35,003, a difference of 0.31%).
| Demographics | Rating | Rank | Median Female Earnings |
| Sioux | 0.0 /100 | #307 | Tragic $35,063 |
| Immigrants | Bahamas | 0.0 /100 | #308 | Tragic $35,027 |
| Hondurans | 0.0 /100 | #309 | Tragic $35,013 |
| Chippewa | 0.0 /100 | #310 | Tragic $35,003 |
| Ute | 0.0 /100 | #311 | Tragic $34,960 |
| Yaqui | 0.0 /100 | #312 | Tragic $34,943 |
| Cubans | 0.0 /100 | #313 | Tragic $34,942 |
| Apache | 0.0 /100 | #314 | Tragic $34,895 |
| Pennsylvania Germans | 0.0 /100 | #315 | Tragic $34,802 |
| Cherokee | 0.0 /100 | #316 | Tragic $34,742 |
| Potawatomi | 0.0 /100 | #317 | Tragic $34,739 |
| Immigrants | Yemen | 0.0 /100 | #318 | Tragic $34,693 |
| Shoshone | 0.0 /100 | #319 | Tragic $34,677 |
| Immigrants | Honduras | 0.0 /100 | #320 | Tragic $34,647 |
| Hispanics or Latinos | 0.0 /100 | #321 | Tragic $34,421 |
Demographics Similar to Immigrants from Philippines by Median Female Earnings
In terms of median female earnings, the demographic groups most similar to Immigrants from Philippines are Immigrants from Kuwait ($41,055, a difference of 0.15%), Immigrants from Lebanon ($41,183, a difference of 0.17%), Croatian ($40,993, a difference of 0.30%), Immigrants from Jordan ($40,977, a difference of 0.33%), and Guyanese ($40,973, a difference of 0.34%).
| Demographics | Rating | Rank | Median Female Earnings |
| Immigrants | North America | 96.7 /100 | #112 | Exceptional $41,319 |
| Macedonians | 96.4 /100 | #113 | Exceptional $41,286 |
| Immigrants | England | 96.4 /100 | #114 | Exceptional $41,277 |
| Koreans | 96.4 /100 | #115 | Exceptional $41,276 |
| Immigrants | Brazil | 96.4 /100 | #116 | Exceptional $41,273 |
| Barbadians | 96.3 /100 | #117 | Exceptional $41,261 |
| Immigrants | Lebanon | 95.6 /100 | #118 | Exceptional $41,183 |
| Immigrants | Philippines | 95.0 /100 | #119 | Exceptional $41,114 |
| Immigrants | Kuwait | 94.4 /100 | #120 | Exceptional $41,055 |
| Croatians | 93.7 /100 | #121 | Exceptional $40,993 |
| Immigrants | Jordan | 93.5 /100 | #122 | Exceptional $40,977 |
| Guyanese | 93.4 /100 | #123 | Exceptional $40,973 |
| Trinidadians and Tobagonians | 93.2 /100 | #124 | Exceptional $40,958 |
| Austrians | 92.7 /100 | #125 | Exceptional $40,923 |
| Immigrants | Trinidad and Tobago | 92.3 /100 | #126 | Exceptional $40,895 |