Apache vs Immigrants from Turkey Median Female Earnings
COMPARE
Apache
Immigrants from Turkey
Median Female Earnings
Median Female Earnings Comparison
Apache
Immigrants from Turkey
$34,895
MEDIAN FEMALE EARNINGS
0.0/ 100
METRIC RATING
314th/ 347
METRIC RANK
$44,066
MEDIAN FEMALE EARNINGS
100.0/ 100
METRIC RATING
36th/ 347
METRIC RANK
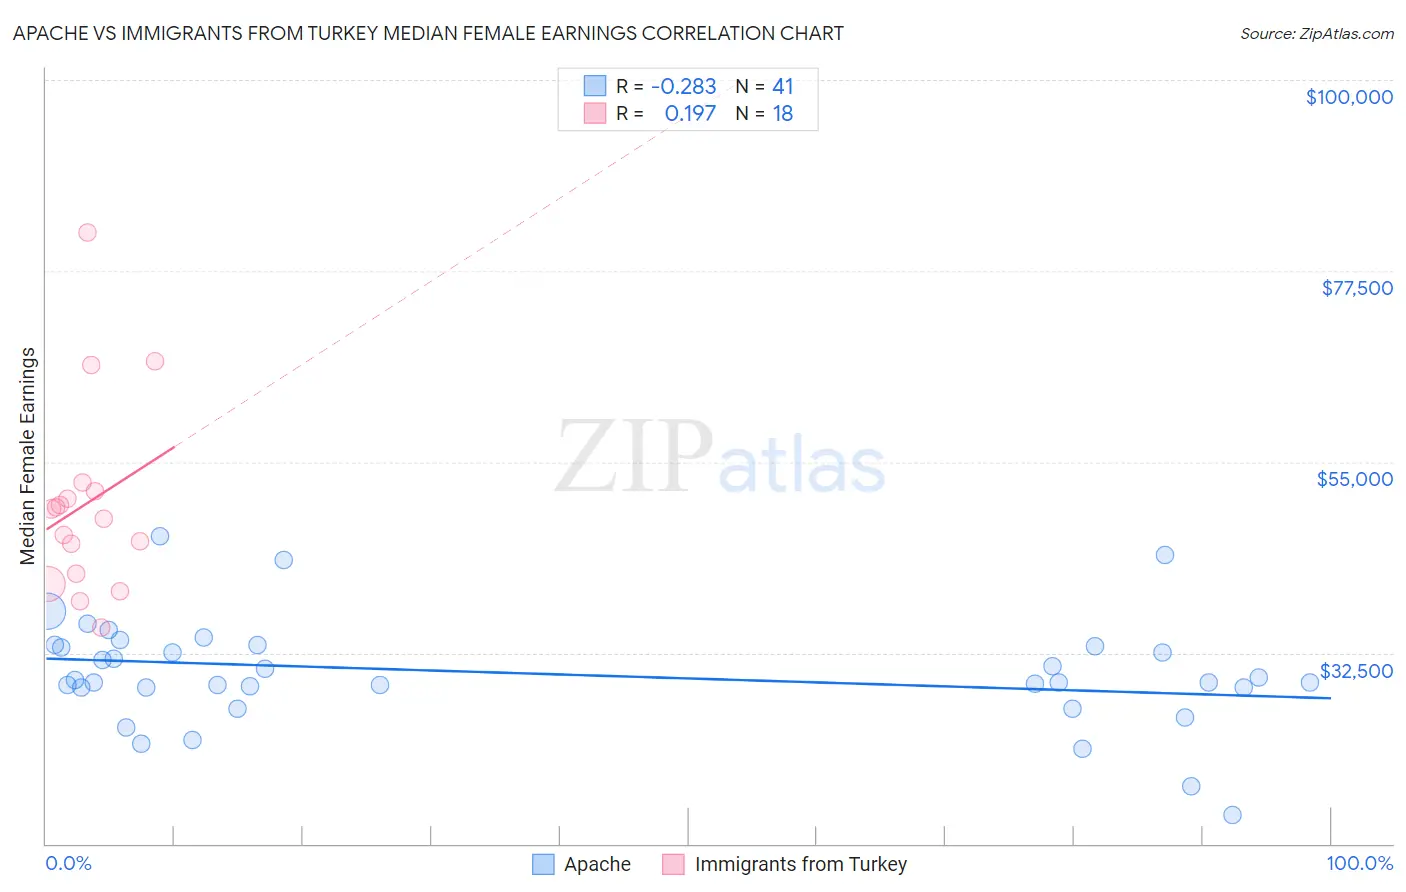
Apache vs Immigrants from Turkey Median Female Earnings Correlation Chart
The statistical analysis conducted on geographies consisting of 230,997,872 people shows a weak negative correlation between the proportion of Apache and median female earnings in the United States with a correlation coefficient (R) of -0.283 and weighted average of $34,895. Similarly, the statistical analysis conducted on geographies consisting of 223,023,640 people shows a poor positive correlation between the proportion of Immigrants from Turkey and median female earnings in the United States with a correlation coefficient (R) of 0.197 and weighted average of $44,066, a difference of 26.3%.
Median Female Earnings Correlation Summary
| Measurement | Apache | Immigrants from Turkey |
| Minimum | $13,381 | $35,410 |
| Maximum | $46,250 | $82,017 |
| Range | $32,869 | $46,607 |
| Mean | $30,090 | $50,062 |
| Median | $29,044 | $48,920 |
| Interquartile 25% (IQ1) | $28,433 | $41,873 |
| Interquartile 75% (IQ3) | $33,369 | $51,472 |
| Interquartile Range (IQR) | $4,936 | $9,599 |
| Standard Deviation (Sample) | $6,387 | $11,491 |
| Standard Deviation (Population) | $6,309 | $11,167 |
Similar Demographics by Median Female Earnings
Demographics Similar to Apache by Median Female Earnings
In terms of median female earnings, the demographic groups most similar to Apache are Cuban ($34,942, a difference of 0.13%), Yaqui ($34,943, a difference of 0.14%), Ute ($34,960, a difference of 0.19%), Pennsylvania German ($34,802, a difference of 0.27%), and Chippewa ($35,003, a difference of 0.31%).
| Demographics | Rating | Rank | Median Female Earnings |
| Sioux | 0.0 /100 | #307 | Tragic $35,063 |
| Immigrants | Bahamas | 0.0 /100 | #308 | Tragic $35,027 |
| Hondurans | 0.0 /100 | #309 | Tragic $35,013 |
| Chippewa | 0.0 /100 | #310 | Tragic $35,003 |
| Ute | 0.0 /100 | #311 | Tragic $34,960 |
| Yaqui | 0.0 /100 | #312 | Tragic $34,943 |
| Cubans | 0.0 /100 | #313 | Tragic $34,942 |
| Apache | 0.0 /100 | #314 | Tragic $34,895 |
| Pennsylvania Germans | 0.0 /100 | #315 | Tragic $34,802 |
| Cherokee | 0.0 /100 | #316 | Tragic $34,742 |
| Potawatomi | 0.0 /100 | #317 | Tragic $34,739 |
| Immigrants | Yemen | 0.0 /100 | #318 | Tragic $34,693 |
| Shoshone | 0.0 /100 | #319 | Tragic $34,677 |
| Immigrants | Honduras | 0.0 /100 | #320 | Tragic $34,647 |
| Hispanics or Latinos | 0.0 /100 | #321 | Tragic $34,421 |
Demographics Similar to Immigrants from Turkey by Median Female Earnings
In terms of median female earnings, the demographic groups most similar to Immigrants from Turkey are Immigrants from Switzerland ($43,996, a difference of 0.16%), Immigrants from Sri Lanka ($44,161, a difference of 0.21%), Russian ($44,169, a difference of 0.23%), Latvian ($43,941, a difference of 0.28%), and Immigrants from Asia ($44,198, a difference of 0.30%).
| Demographics | Rating | Rank | Median Female Earnings |
| Immigrants | Belgium | 100.0 /100 | #29 | Exceptional $44,587 |
| Asians | 100.0 /100 | #30 | Exceptional $44,586 |
| Immigrants | France | 100.0 /100 | #31 | Exceptional $44,541 |
| Immigrants | Northern Europe | 100.0 /100 | #32 | Exceptional $44,366 |
| Immigrants | Asia | 100.0 /100 | #33 | Exceptional $44,198 |
| Russians | 100.0 /100 | #34 | Exceptional $44,169 |
| Immigrants | Sri Lanka | 100.0 /100 | #35 | Exceptional $44,161 |
| Immigrants | Turkey | 100.0 /100 | #36 | Exceptional $44,066 |
| Immigrants | Switzerland | 100.0 /100 | #37 | Exceptional $43,996 |
| Latvians | 100.0 /100 | #38 | Exceptional $43,941 |
| Israelis | 100.0 /100 | #39 | Exceptional $43,852 |
| Immigrants | Malaysia | 100.0 /100 | #40 | Exceptional $43,835 |
| Bhutanese | 100.0 /100 | #41 | Exceptional $43,648 |
| Immigrants | Denmark | 100.0 /100 | #42 | Exceptional $43,646 |
| Bulgarians | 100.0 /100 | #43 | Exceptional $43,638 |