Apache vs Ethiopian Median Female Earnings
COMPARE
Apache
Ethiopian
Median Female Earnings
Median Female Earnings Comparison
Apache
Ethiopians
$34,895
MEDIAN FEMALE EARNINGS
0.0/ 100
METRIC RATING
314th/ 347
METRIC RANK
$43,243
MEDIAN FEMALE EARNINGS
99.9/ 100
METRIC RATING
57th/ 347
METRIC RANK
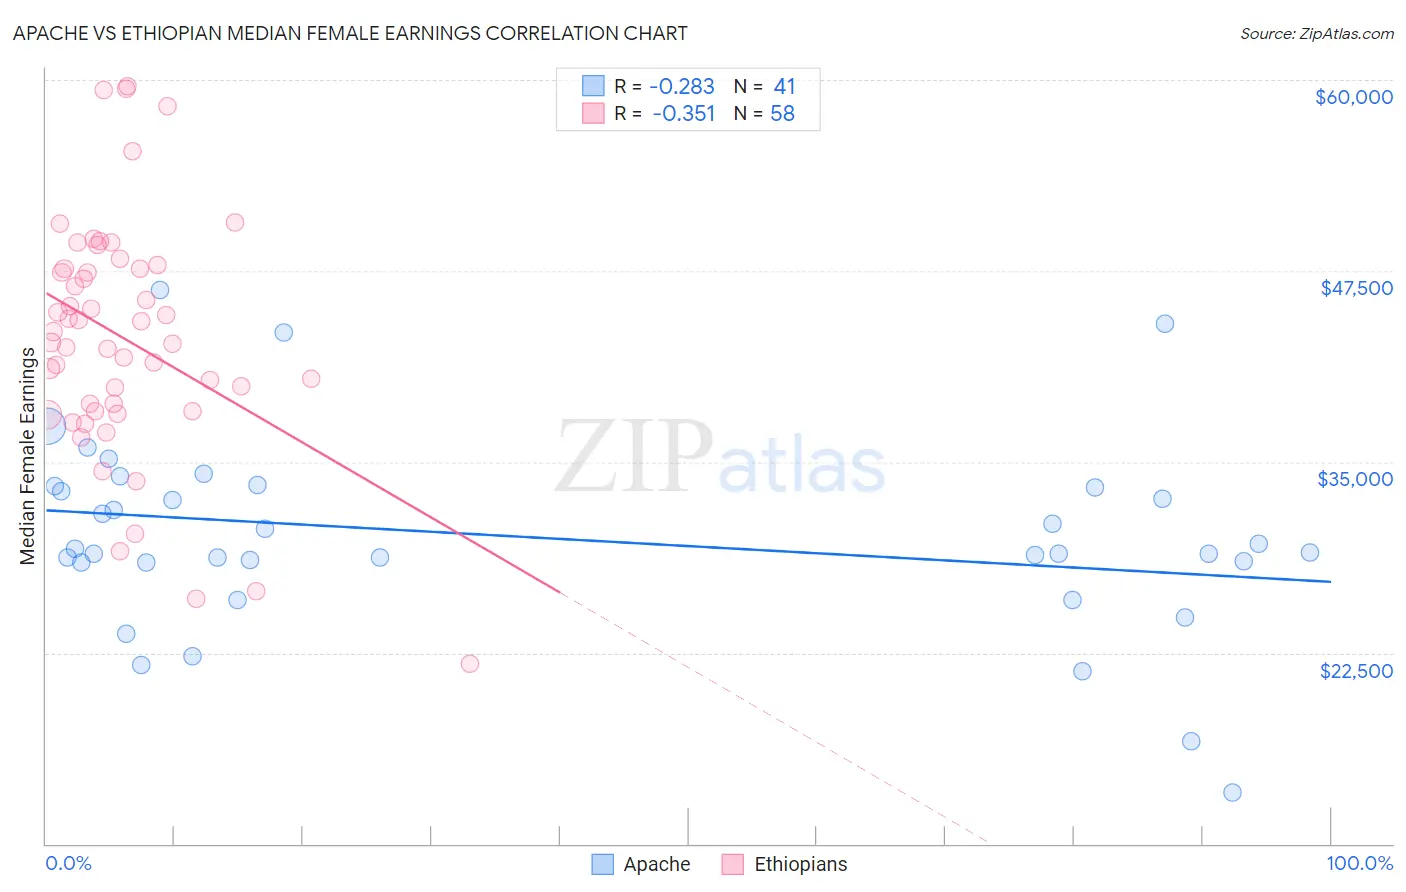
Apache vs Ethiopian Median Female Earnings Correlation Chart
The statistical analysis conducted on geographies consisting of 230,997,872 people shows a weak negative correlation between the proportion of Apache and median female earnings in the United States with a correlation coefficient (R) of -0.283 and weighted average of $34,895. Similarly, the statistical analysis conducted on geographies consisting of 223,241,748 people shows a mild negative correlation between the proportion of Ethiopians and median female earnings in the United States with a correlation coefficient (R) of -0.351 and weighted average of $43,243, a difference of 23.9%.
Median Female Earnings Correlation Summary
| Measurement | Apache | Ethiopian |
| Minimum | $13,381 | $21,797 |
| Maximum | $46,250 | $59,585 |
| Range | $32,869 | $37,788 |
| Mean | $30,090 | $43,098 |
| Median | $29,044 | $43,184 |
| Interquartile 25% (IQ1) | $28,433 | $38,309 |
| Interquartile 75% (IQ3) | $33,369 | $47,681 |
| Interquartile Range (IQR) | $4,936 | $9,372 |
| Standard Deviation (Sample) | $6,387 | $7,882 |
| Standard Deviation (Population) | $6,309 | $7,814 |
Similar Demographics by Median Female Earnings
Demographics Similar to Apache by Median Female Earnings
In terms of median female earnings, the demographic groups most similar to Apache are Cuban ($34,942, a difference of 0.13%), Yaqui ($34,943, a difference of 0.14%), Ute ($34,960, a difference of 0.19%), Pennsylvania German ($34,802, a difference of 0.27%), and Chippewa ($35,003, a difference of 0.31%).
| Demographics | Rating | Rank | Median Female Earnings |
| Sioux | 0.0 /100 | #307 | Tragic $35,063 |
| Immigrants | Bahamas | 0.0 /100 | #308 | Tragic $35,027 |
| Hondurans | 0.0 /100 | #309 | Tragic $35,013 |
| Chippewa | 0.0 /100 | #310 | Tragic $35,003 |
| Ute | 0.0 /100 | #311 | Tragic $34,960 |
| Yaqui | 0.0 /100 | #312 | Tragic $34,943 |
| Cubans | 0.0 /100 | #313 | Tragic $34,942 |
| Apache | 0.0 /100 | #314 | Tragic $34,895 |
| Pennsylvania Germans | 0.0 /100 | #315 | Tragic $34,802 |
| Cherokee | 0.0 /100 | #316 | Tragic $34,742 |
| Potawatomi | 0.0 /100 | #317 | Tragic $34,739 |
| Immigrants | Yemen | 0.0 /100 | #318 | Tragic $34,693 |
| Shoshone | 0.0 /100 | #319 | Tragic $34,677 |
| Immigrants | Honduras | 0.0 /100 | #320 | Tragic $34,647 |
| Hispanics or Latinos | 0.0 /100 | #321 | Tragic $34,421 |
Demographics Similar to Ethiopians by Median Female Earnings
In terms of median female earnings, the demographic groups most similar to Ethiopians are Immigrants from Croatia ($43,258, a difference of 0.040%), Egyptian ($43,305, a difference of 0.14%), Immigrants from Eastern Europe ($43,309, a difference of 0.15%), Australian ($43,308, a difference of 0.15%), and Paraguayan ($43,173, a difference of 0.16%).
| Demographics | Rating | Rank | Median Female Earnings |
| Immigrants | Uzbekistan | 100.0 /100 | #50 | Exceptional $43,363 |
| Maltese | 100.0 /100 | #51 | Exceptional $43,357 |
| Immigrants | Lithuania | 99.9 /100 | #52 | Exceptional $43,317 |
| Immigrants | Eastern Europe | 99.9 /100 | #53 | Exceptional $43,309 |
| Australians | 99.9 /100 | #54 | Exceptional $43,308 |
| Egyptians | 99.9 /100 | #55 | Exceptional $43,305 |
| Immigrants | Croatia | 99.9 /100 | #56 | Exceptional $43,258 |
| Ethiopians | 99.9 /100 | #57 | Exceptional $43,243 |
| Paraguayans | 99.9 /100 | #58 | Exceptional $43,173 |
| Estonians | 99.9 /100 | #59 | Exceptional $43,106 |
| Immigrants | Latvia | 99.9 /100 | #60 | Exceptional $43,099 |
| Immigrants | Bulgaria | 99.9 /100 | #61 | Exceptional $43,085 |
| Afghans | 99.9 /100 | #62 | Exceptional $43,077 |
| Immigrants | Ukraine | 99.9 /100 | #63 | Exceptional $43,069 |
| Immigrants | Pakistan | 99.9 /100 | #64 | Exceptional $43,052 |