Immigrants from Netherlands vs Creek Wage/Income Gap
COMPARE
Immigrants from Netherlands
Creek
Wage/Income Gap
Wage/Income Gap Comparison
Immigrants from Netherlands
Creek
28.5%
WAGE/INCOME GAP
0.2/ 100
METRIC RATING
304th/ 347
METRIC RANK
27.1%
WAGE/INCOME GAP
3.8/ 100
METRIC RATING
241st/ 347
METRIC RANK
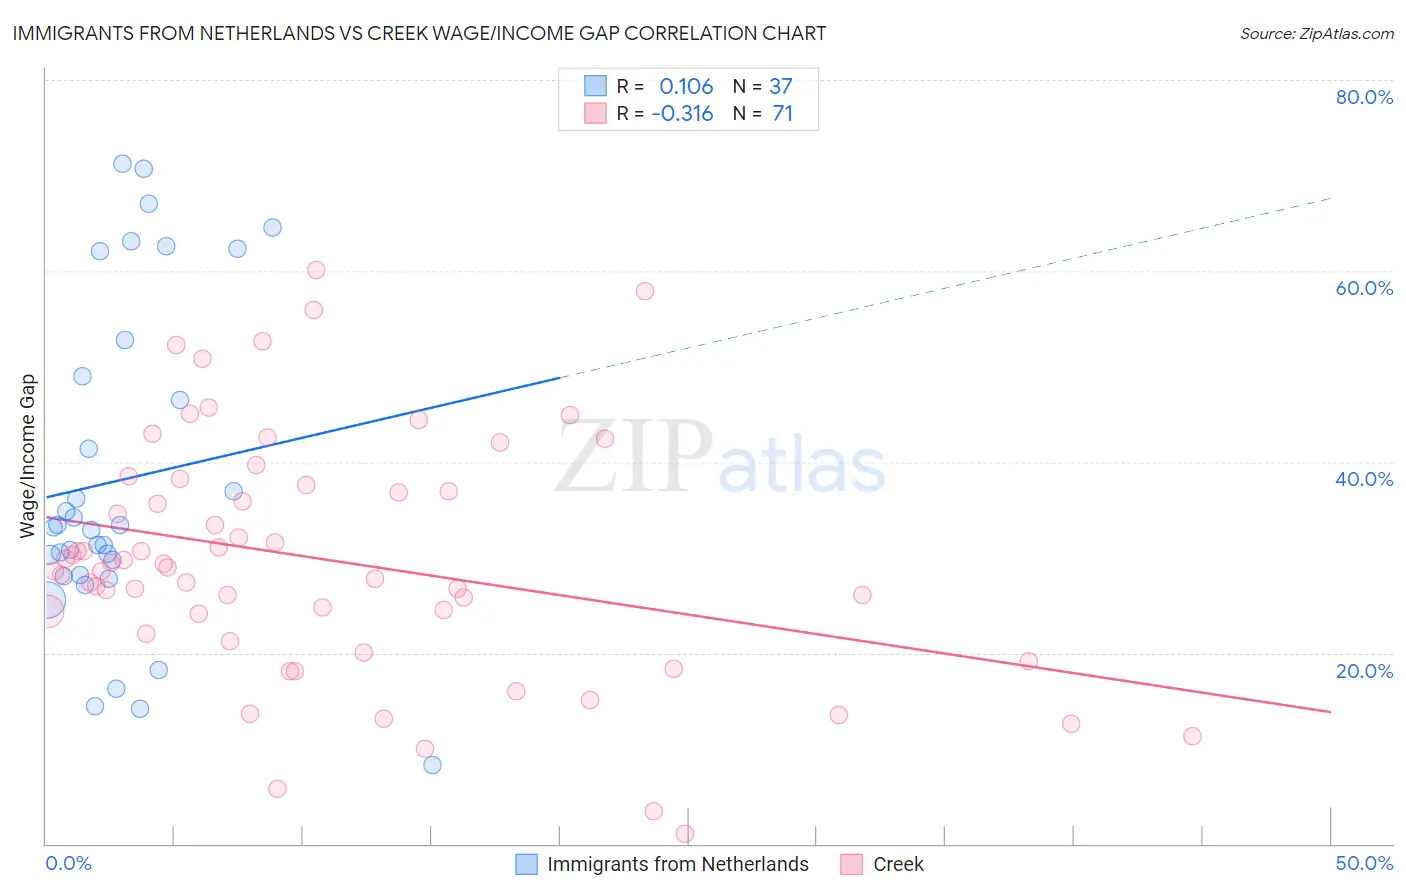
Immigrants from Netherlands vs Creek Wage/Income Gap Correlation Chart
The statistical analysis conducted on geographies consisting of 237,766,220 people shows a poor positive correlation between the proportion of Immigrants from Netherlands and wage/income gap percentage in the United States with a correlation coefficient (R) of 0.106 and weighted average of 28.5%. Similarly, the statistical analysis conducted on geographies consisting of 178,368,499 people shows a mild negative correlation between the proportion of Creek and wage/income gap percentage in the United States with a correlation coefficient (R) of -0.316 and weighted average of 27.1%, a difference of 5.1%.
Wage/Income Gap Correlation Summary
| Measurement | Immigrants from Netherlands | Creek |
| Minimum | 8.2% | 0.99% |
| Maximum | 71.2% | 60.1% |
| Range | 63.0% | 59.1% |
| Mean | 38.1% | 29.8% |
| Median | 33.2% | 28.9% |
| Interquartile 25% (IQ1) | 28.1% | 22.0% |
| Interquartile 75% (IQ3) | 50.9% | 37.6% |
| Interquartile Range (IQR) | 22.8% | 15.5% |
| Standard Deviation (Sample) | 17.1% | 12.7% |
| Standard Deviation (Population) | 16.9% | 12.6% |
Similar Demographics by Wage/Income Gap
Demographics Similar to Immigrants from Netherlands by Wage/Income Gap
In terms of wage/income gap, the demographic groups most similar to Immigrants from Netherlands are Immigrants from South Africa (28.5%, a difference of 0.020%), White/Caucasian (28.5%, a difference of 0.060%), Immigrants from Denmark (28.5%, a difference of 0.070%), Scotch-Irish (28.5%, a difference of 0.080%), and Irish (28.5%, a difference of 0.080%).
| Demographics | Rating | Rank | Wage/Income Gap |
| Immigrants | North America | 0.2 /100 | #297 | Tragic 28.4% |
| Austrians | 0.2 /100 | #298 | Tragic 28.4% |
| Immigrants | North Macedonia | 0.2 /100 | #299 | Tragic 28.4% |
| Immigrants | Northern Europe | 0.2 /100 | #300 | Tragic 28.5% |
| Immigrants | Canada | 0.2 /100 | #301 | Tragic 28.5% |
| Scotch-Irish | 0.2 /100 | #302 | Tragic 28.5% |
| Irish | 0.2 /100 | #303 | Tragic 28.5% |
| Immigrants | Netherlands | 0.2 /100 | #304 | Tragic 28.5% |
| Immigrants | South Africa | 0.1 /100 | #305 | Tragic 28.5% |
| Whites/Caucasians | 0.1 /100 | #306 | Tragic 28.5% |
| Immigrants | Denmark | 0.1 /100 | #307 | Tragic 28.5% |
| Poles | 0.1 /100 | #308 | Tragic 28.5% |
| Macedonians | 0.1 /100 | #309 | Tragic 28.6% |
| Finns | 0.1 /100 | #310 | Tragic 28.6% |
| Immigrants | Lithuania | 0.1 /100 | #311 | Tragic 28.6% |
Demographics Similar to Creek by Wage/Income Gap
In terms of wage/income gap, the demographic groups most similar to Creek are Immigrants from Europe (27.1%, a difference of 0.020%), Immigrants from Sri Lanka (27.1%, a difference of 0.050%), Spanish (27.1%, a difference of 0.060%), Chickasaw (27.2%, a difference of 0.13%), and Immigrants from the Azores (27.2%, a difference of 0.14%).
| Demographics | Rating | Rank | Wage/Income Gap |
| Immigrants | Pakistan | 4.9 /100 | #234 | Tragic 27.0% |
| Immigrants | Hungary | 4.8 /100 | #235 | Tragic 27.0% |
| Immigrants | Romania | 4.8 /100 | #236 | Tragic 27.0% |
| Immigrants | Eastern Asia | 4.4 /100 | #237 | Tragic 27.1% |
| Osage | 4.4 /100 | #238 | Tragic 27.1% |
| Estonians | 4.3 /100 | #239 | Tragic 27.1% |
| Immigrants | Europe | 3.8 /100 | #240 | Tragic 27.1% |
| Creek | 3.8 /100 | #241 | Tragic 27.1% |
| Immigrants | Sri Lanka | 3.7 /100 | #242 | Tragic 27.1% |
| Spanish | 3.6 /100 | #243 | Tragic 27.1% |
| Chickasaw | 3.5 /100 | #244 | Tragic 27.2% |
| Immigrants | Azores | 3.5 /100 | #245 | Tragic 27.2% |
| Immigrants | Nonimmigrants | 3.3 /100 | #246 | Tragic 27.2% |
| Celtics | 2.8 /100 | #247 | Tragic 27.3% |
| Cypriots | 2.8 /100 | #248 | Tragic 27.3% |