Alaska Native vs Immigrants from Bolivia Wage/Income Gap
COMPARE
Alaska Native
Immigrants from Bolivia
Wage/Income Gap
Wage/Income Gap Comparison
Alaska Natives
Immigrants from Bolivia
24.4%
WAGE/INCOME GAP
96.0/ 100
METRIC RATING
116th/ 347
METRIC RANK
26.0%
WAGE/INCOME GAP
36.4/ 100
METRIC RATING
181st/ 347
METRIC RANK
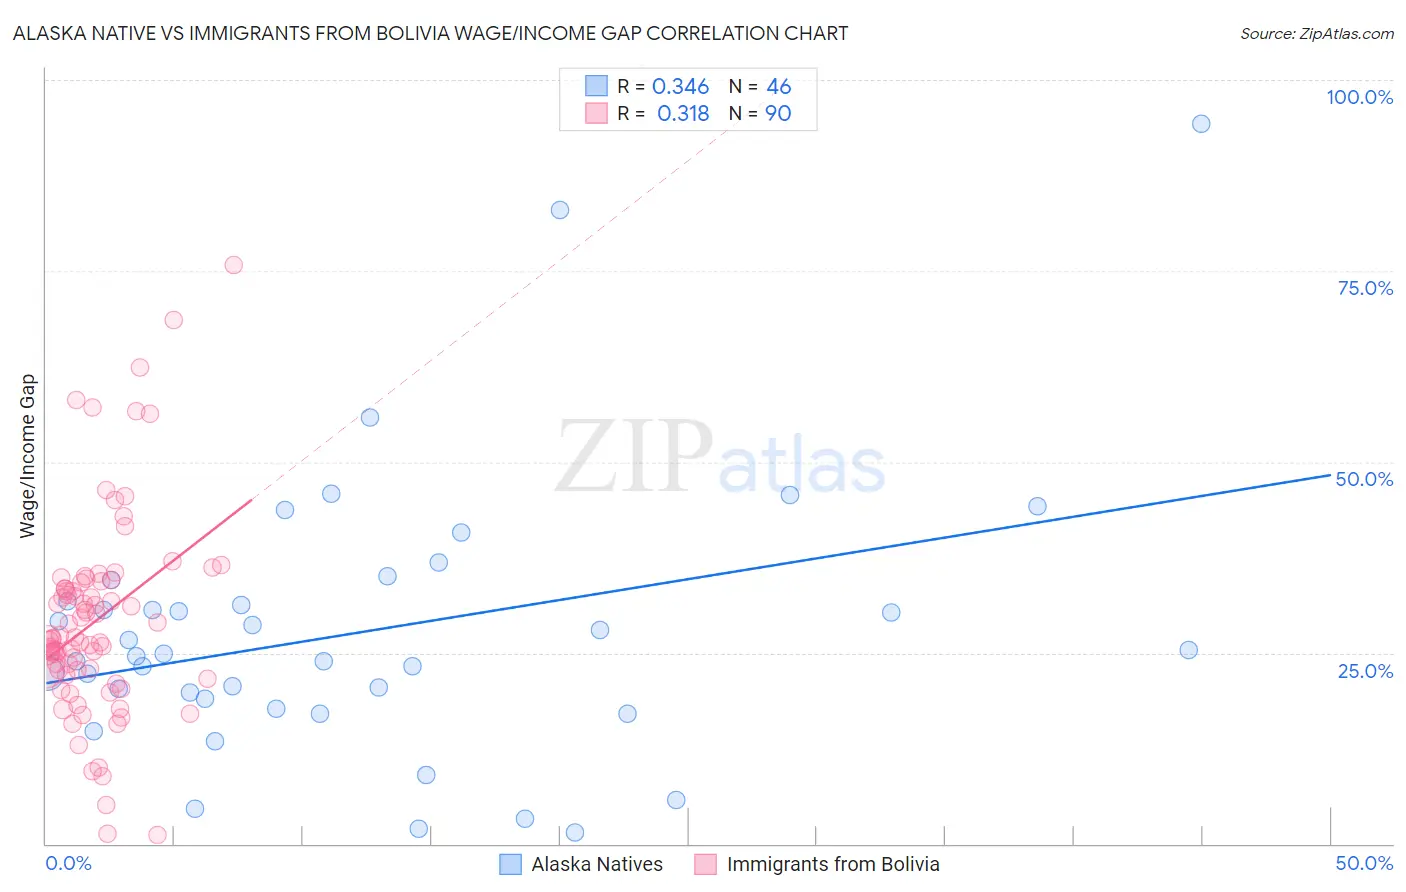
Alaska Native vs Immigrants from Bolivia Wage/Income Gap Correlation Chart
The statistical analysis conducted on geographies consisting of 76,725,822 people shows a mild positive correlation between the proportion of Alaska Natives and wage/income gap percentage in the United States with a correlation coefficient (R) of 0.346 and weighted average of 24.4%. Similarly, the statistical analysis conducted on geographies consisting of 158,701,759 people shows a mild positive correlation between the proportion of Immigrants from Bolivia and wage/income gap percentage in the United States with a correlation coefficient (R) of 0.318 and weighted average of 26.0%, a difference of 6.5%.
Wage/Income Gap Correlation Summary
| Measurement | Alaska Native | Immigrants from Bolivia |
| Minimum | 1.4% | 1.1% |
| Maximum | 94.2% | 75.7% |
| Range | 92.8% | 74.6% |
| Mean | 27.7% | 29.2% |
| Median | 24.7% | 26.9% |
| Interquartile 25% (IQ1) | 18.9% | 22.8% |
| Interquartile 75% (IQ3) | 31.7% | 34.2% |
| Interquartile Range (IQR) | 12.8% | 11.5% |
| Standard Deviation (Sample) | 17.8% | 13.1% |
| Standard Deviation (Population) | 17.6% | 13.1% |
Similar Demographics by Wage/Income Gap
Demographics Similar to Alaska Natives by Wage/Income Gap
In terms of wage/income gap, the demographic groups most similar to Alaska Natives are Immigrants from Afghanistan (24.4%, a difference of 0.060%), Immigrants from Micronesia (24.4%, a difference of 0.090%), Kenyan (24.5%, a difference of 0.11%), Immigrants from Kenya (24.4%, a difference of 0.17%), and Cree (24.5%, a difference of 0.19%).
| Demographics | Rating | Rank | Wage/Income Gap |
| Ugandans | 98.3 /100 | #109 | Exceptional 24.1% |
| Immigrants | Morocco | 98.1 /100 | #110 | Exceptional 24.1% |
| Soviet Union | 97.6 /100 | #111 | Exceptional 24.2% |
| Immigrants | Colombia | 97.0 /100 | #112 | Exceptional 24.3% |
| Sioux | 96.9 /100 | #113 | Exceptional 24.3% |
| Panamanians | 96.5 /100 | #114 | Exceptional 24.4% |
| Immigrants | Kenya | 96.4 /100 | #115 | Exceptional 24.4% |
| Alaska Natives | 96.0 /100 | #116 | Exceptional 24.4% |
| Immigrants | Afghanistan | 95.9 /100 | #117 | Exceptional 24.4% |
| Immigrants | Micronesia | 95.8 /100 | #118 | Exceptional 24.4% |
| Kenyans | 95.8 /100 | #119 | Exceptional 24.5% |
| Cree | 95.6 /100 | #120 | Exceptional 24.5% |
| Immigrants | Thailand | 94.9 /100 | #121 | Exceptional 24.5% |
| Apache | 94.8 /100 | #122 | Exceptional 24.5% |
| Natives/Alaskans | 94.6 /100 | #123 | Exceptional 24.6% |
Demographics Similar to Immigrants from Bolivia by Wage/Income Gap
In terms of wage/income gap, the demographic groups most similar to Immigrants from Bolivia are Immigrants from Serbia (26.0%, a difference of 0.070%), Immigrants from Kazakhstan (26.0%, a difference of 0.090%), Guamanian/Chamorro (26.0%, a difference of 0.11%), Mexican (26.0%, a difference of 0.14%), and Samoan (26.0%, a difference of 0.15%).
| Demographics | Rating | Rank | Wage/Income Gap |
| Alaskan Athabascans | 50.0 /100 | #174 | Average 25.8% |
| Sri Lankans | 47.0 /100 | #175 | Average 25.8% |
| Paraguayans | 46.7 /100 | #176 | Average 25.8% |
| Cambodians | 45.1 /100 | #177 | Average 25.8% |
| Chinese | 42.0 /100 | #178 | Average 25.9% |
| Samoans | 38.6 /100 | #179 | Fair 26.0% |
| Guamanians/Chamorros | 38.0 /100 | #180 | Fair 26.0% |
| Immigrants | Bolivia | 36.4 /100 | #181 | Fair 26.0% |
| Immigrants | Serbia | 35.4 /100 | #182 | Fair 26.0% |
| Immigrants | Kazakhstan | 35.2 /100 | #183 | Fair 26.0% |
| Mexicans | 34.4 /100 | #184 | Fair 26.0% |
| Pakistanis | 33.7 /100 | #185 | Fair 26.1% |
| Immigrants | Indonesia | 32.5 /100 | #186 | Fair 26.1% |
| Palestinians | 29.9 /100 | #187 | Fair 26.1% |
| Immigrants | Egypt | 29.9 /100 | #188 | Fair 26.1% |