Alaska Native vs Immigrants from Guyana Wage/Income Gap
COMPARE
Alaska Native
Immigrants from Guyana
Wage/Income Gap
Wage/Income Gap Comparison
Alaska Natives
Immigrants from Guyana
24.4%
WAGE/INCOME GAP
96.0/ 100
METRIC RATING
116th/ 347
METRIC RANK
18.4%
WAGE/INCOME GAP
100.0/ 100
METRIC RATING
6th/ 347
METRIC RANK
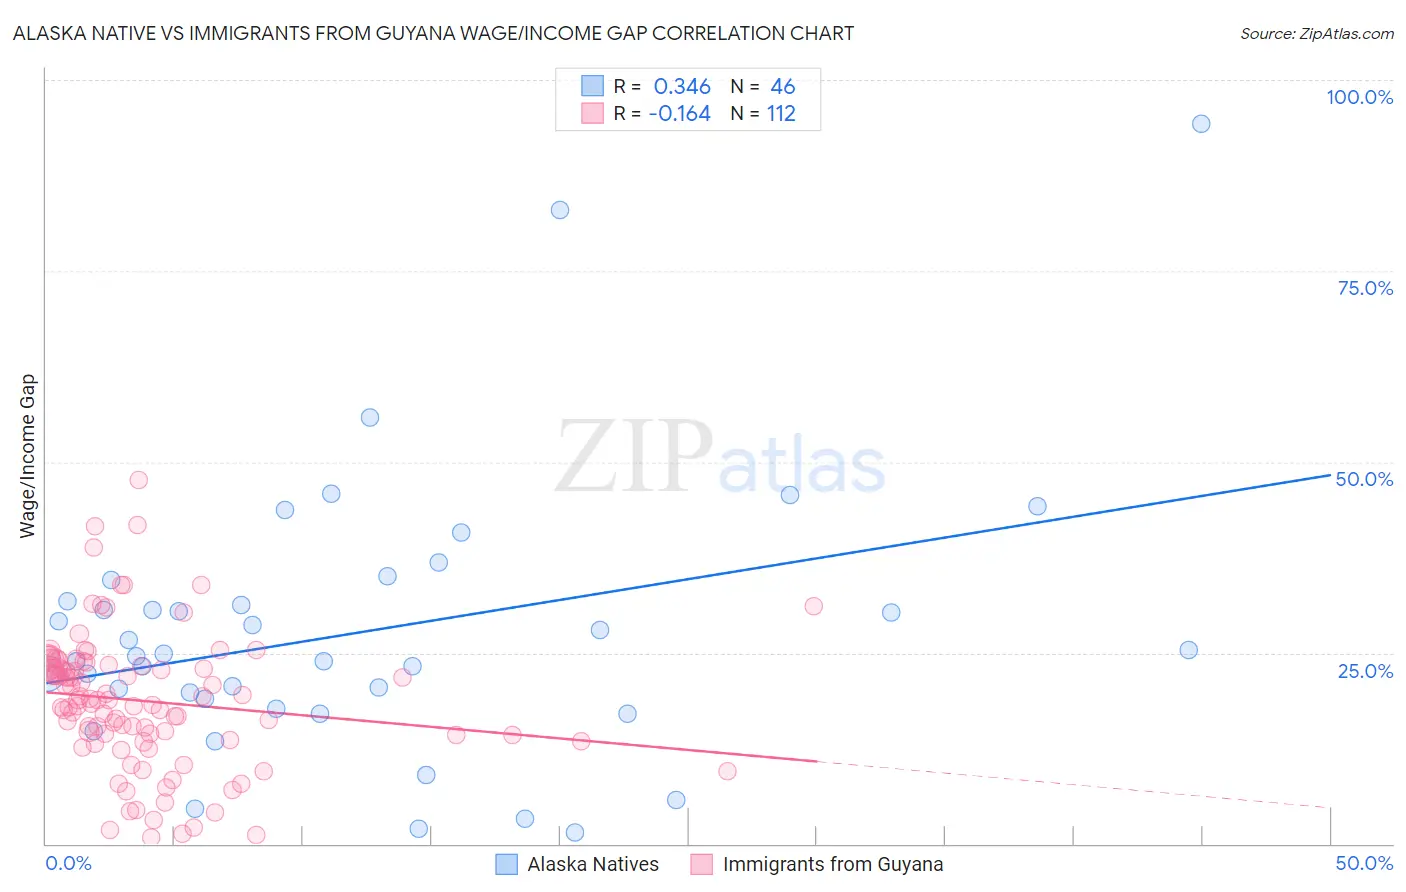
Alaska Native vs Immigrants from Guyana Wage/Income Gap Correlation Chart
The statistical analysis conducted on geographies consisting of 76,725,822 people shows a mild positive correlation between the proportion of Alaska Natives and wage/income gap percentage in the United States with a correlation coefficient (R) of 0.346 and weighted average of 24.4%. Similarly, the statistical analysis conducted on geographies consisting of 183,675,272 people shows a poor negative correlation between the proportion of Immigrants from Guyana and wage/income gap percentage in the United States with a correlation coefficient (R) of -0.164 and weighted average of 18.4%, a difference of 33.1%.
Wage/Income Gap Correlation Summary
| Measurement | Alaska Native | Immigrants from Guyana |
| Minimum | 1.4% | 0.78% |
| Maximum | 94.2% | 47.7% |
| Range | 92.8% | 46.9% |
| Mean | 27.7% | 18.7% |
| Median | 24.7% | 18.8% |
| Interquartile 25% (IQ1) | 18.9% | 13.9% |
| Interquartile 75% (IQ3) | 31.7% | 23.4% |
| Interquartile Range (IQR) | 12.8% | 9.4% |
| Standard Deviation (Sample) | 17.8% | 8.8% |
| Standard Deviation (Population) | 17.6% | 8.8% |
Similar Demographics by Wage/Income Gap
Demographics Similar to Alaska Natives by Wage/Income Gap
In terms of wage/income gap, the demographic groups most similar to Alaska Natives are Immigrants from Afghanistan (24.4%, a difference of 0.060%), Immigrants from Micronesia (24.4%, a difference of 0.090%), Kenyan (24.5%, a difference of 0.11%), Immigrants from Kenya (24.4%, a difference of 0.17%), and Cree (24.5%, a difference of 0.19%).
| Demographics | Rating | Rank | Wage/Income Gap |
| Ugandans | 98.3 /100 | #109 | Exceptional 24.1% |
| Immigrants | Morocco | 98.1 /100 | #110 | Exceptional 24.1% |
| Soviet Union | 97.6 /100 | #111 | Exceptional 24.2% |
| Immigrants | Colombia | 97.0 /100 | #112 | Exceptional 24.3% |
| Sioux | 96.9 /100 | #113 | Exceptional 24.3% |
| Panamanians | 96.5 /100 | #114 | Exceptional 24.4% |
| Immigrants | Kenya | 96.4 /100 | #115 | Exceptional 24.4% |
| Alaska Natives | 96.0 /100 | #116 | Exceptional 24.4% |
| Immigrants | Afghanistan | 95.9 /100 | #117 | Exceptional 24.4% |
| Immigrants | Micronesia | 95.8 /100 | #118 | Exceptional 24.4% |
| Kenyans | 95.8 /100 | #119 | Exceptional 24.5% |
| Cree | 95.6 /100 | #120 | Exceptional 24.5% |
| Immigrants | Thailand | 94.9 /100 | #121 | Exceptional 24.5% |
| Apache | 94.8 /100 | #122 | Exceptional 24.5% |
| Natives/Alaskans | 94.6 /100 | #123 | Exceptional 24.6% |
Demographics Similar to Immigrants from Guyana by Wage/Income Gap
In terms of wage/income gap, the demographic groups most similar to Immigrants from Guyana are Guyanese (18.3%, a difference of 0.26%), British West Indian (18.0%, a difference of 1.9%), Puerto Rican (18.7%, a difference of 2.0%), Immigrants from Jamaica (18.8%, a difference of 2.6%), and Immigrants from Barbados (17.8%, a difference of 2.9%).
| Demographics | Rating | Rank | Wage/Income Gap |
| Immigrants | Grenada | 100.0 /100 | #1 | Exceptional 16.2% |
| Immigrants | St. Vincent and the Grenadines | 100.0 /100 | #2 | Exceptional 16.4% |
| Immigrants | Barbados | 100.0 /100 | #3 | Exceptional 17.8% |
| British West Indians | 100.0 /100 | #4 | Exceptional 18.0% |
| Guyanese | 100.0 /100 | #5 | Exceptional 18.3% |
| Immigrants | Guyana | 100.0 /100 | #6 | Exceptional 18.4% |
| Puerto Ricans | 100.0 /100 | #7 | Exceptional 18.7% |
| Immigrants | Jamaica | 100.0 /100 | #8 | Exceptional 18.8% |
| Barbadians | 100.0 /100 | #9 | Exceptional 19.0% |
| Crow | 100.0 /100 | #10 | Exceptional 19.1% |
| Immigrants | Haiti | 100.0 /100 | #11 | Exceptional 19.2% |
| Immigrants | West Indies | 100.0 /100 | #12 | Exceptional 19.2% |
| Trinidadians and Tobagonians | 100.0 /100 | #13 | Exceptional 19.3% |
| Immigrants | Trinidad and Tobago | 100.0 /100 | #14 | Exceptional 19.3% |
| West Indians | 100.0 /100 | #15 | Exceptional 19.6% |