Zip Codes with the Highest Percentage of Population Employed in Farming, Fishing & Forestry in Bloomington, IL
RELATED REPORTS & OPTIONS
Farming, Fishing & Forestry
Bloomington
Compare Zip Codes
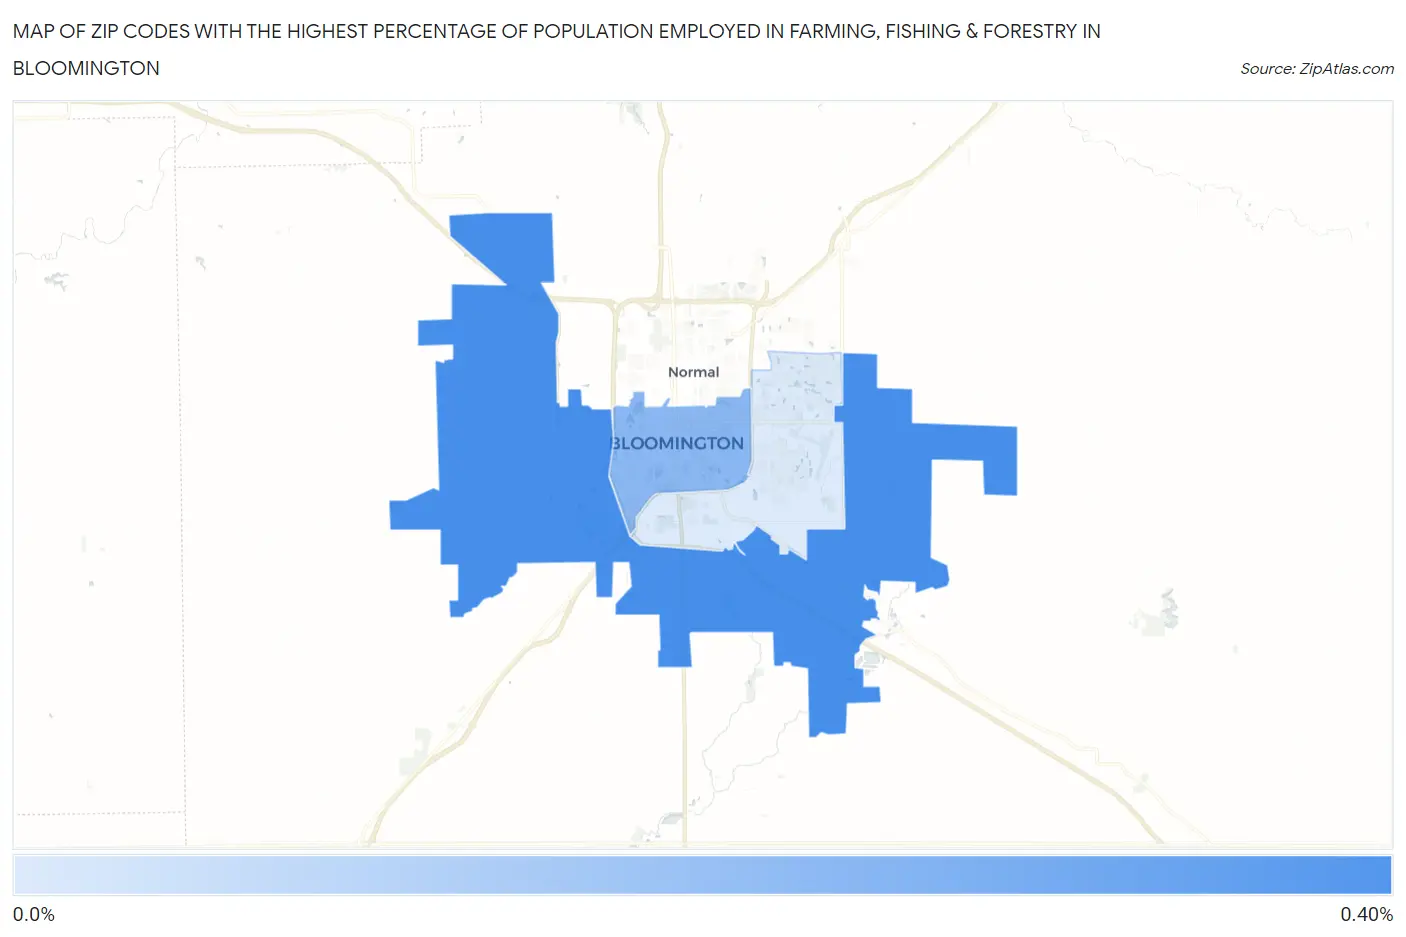
Map of Zip Codes with the Highest Percentage of Population Employed in Farming, Fishing & Forestry in Bloomington
0.031%
0.31%
Zip Codes with the Highest Percentage of Population Employed in Farming, Fishing & Forestry in Bloomington, IL
| Zip Code | % Employed | vs State | vs National | |
| 1. | 61705 | 0.31% | 0.31%(+0.001)#637 | 0.61%(-0.294)#14,702 |
| 2. | 61701 | 0.19% | 0.31%(-0.124)#727 | 0.61%(-0.419)#16,336 |
| 3. | 61704 | 0.031% | 0.31%(-0.279)#825 | 0.61%(-0.574)#18,943 |
1
Common Questions
What are the Top Zip Codes with the Highest Percentage of Population Employed in Farming, Fishing & Forestry in Bloomington, IL?
Top Zip Codes with the Highest Percentage of Population Employed in Farming, Fishing & Forestry in Bloomington, IL are:
What zip code has the Highest Percentage of Population Employed in Farming, Fishing & Forestry in Bloomington, IL?
61705 has the Highest Percentage of Population Employed in Farming, Fishing & Forestry in Bloomington, IL with 0.31%.
What is the Percentage of Population Employed in Farming, Fishing & Forestry in Bloomington, IL?
Percentage of Population Employed in Farming, Fishing & Forestry in Bloomington is 0.099%.
What is the Percentage of Population Employed in Farming, Fishing & Forestry in Illinois?
Percentage of Population Employed in Farming, Fishing & Forestry in Illinois is 0.31%.
What is the Percentage of Population Employed in Farming, Fishing & Forestry in the United States?
Percentage of Population Employed in Farming, Fishing & Forestry in the United States is 0.61%.