Zip Codes with the Highest Percentage of Population Employed in Accommodation & Food Services in Thomasville, GA
RELATED REPORTS & OPTIONS
Accommodation & Food Services
Thomasville
Compare Zip Codes
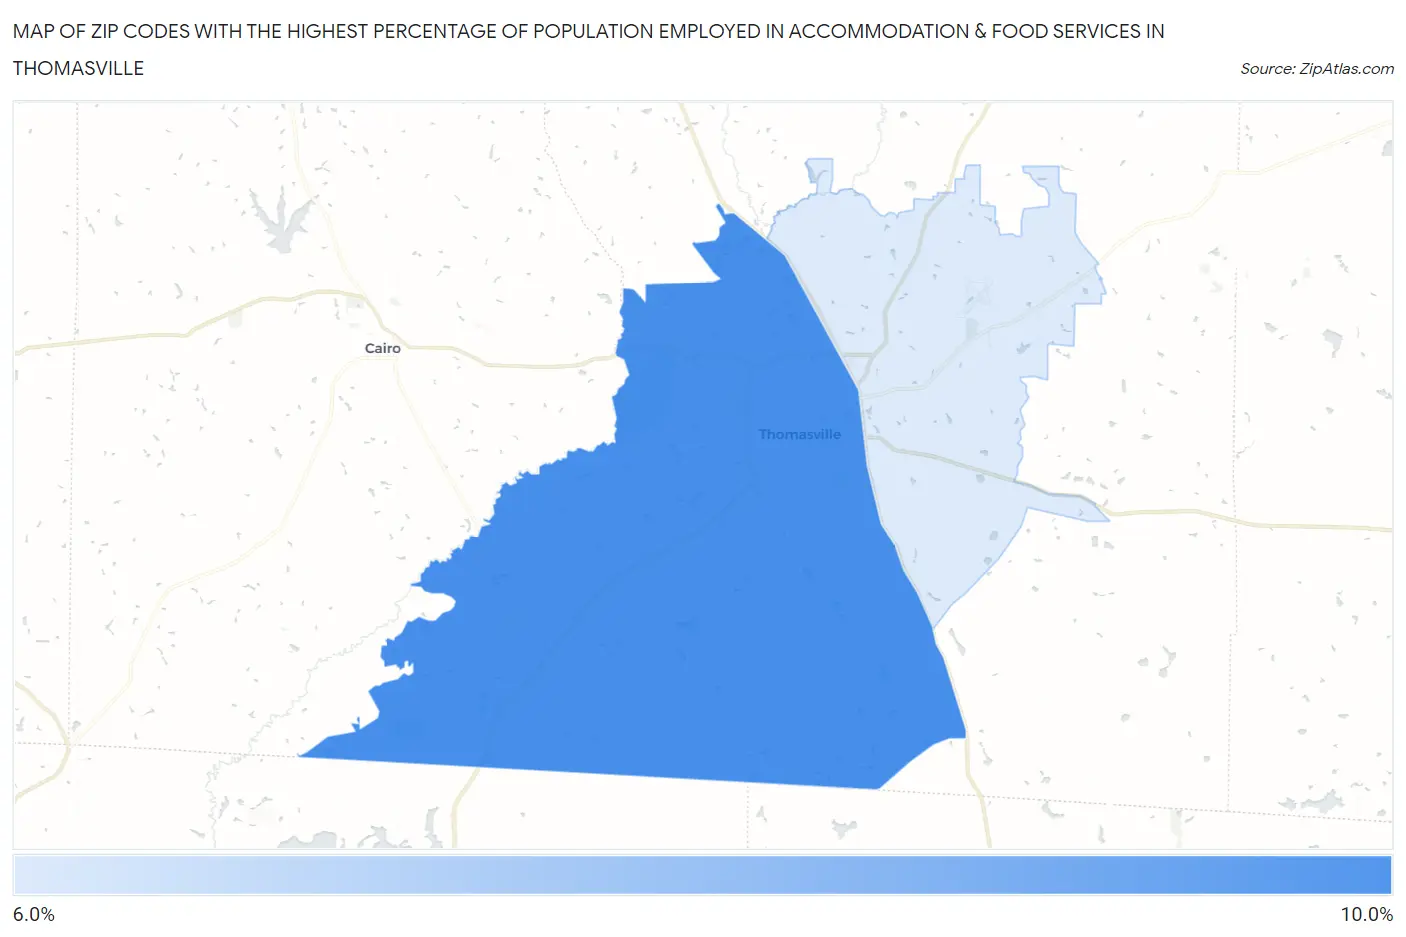
Map of Zip Codes with the Highest Percentage of Population Employed in Accommodation & Food Services in Thomasville
6.6%
9.1%
Zip Codes with the Highest Percentage of Population Employed in Accommodation & Food Services in Thomasville, GA
| Zip Code | % Employed | vs State | vs National | |
| 1. | 31792 | 9.1% | 7.2%(+1.86)#142 | 6.9%(+2.19)#5,861 |
| 2. | 31757 | 6.6% | 7.2%(-0.592)#313 | 6.9%(-0.267)#11,481 |
1
Common Questions
What are the Top Zip Codes with the Highest Percentage of Population Employed in Accommodation & Food Services in Thomasville, GA?
Top Zip Codes with the Highest Percentage of Population Employed in Accommodation & Food Services in Thomasville, GA are:
What zip code has the Highest Percentage of Population Employed in Accommodation & Food Services in Thomasville, GA?
31792 has the Highest Percentage of Population Employed in Accommodation & Food Services in Thomasville, GA with 9.1%.
What is the Percentage of Population Employed in Accommodation & Food Services in Thomasville, GA?
Percentage of Population Employed in Accommodation & Food Services in Thomasville is 9.8%.
What is the Percentage of Population Employed in Accommodation & Food Services in Georgia?
Percentage of Population Employed in Accommodation & Food Services in Georgia is 7.2%.
What is the Percentage of Population Employed in Accommodation & Food Services in the United States?
Percentage of Population Employed in Accommodation & Food Services in the United States is 6.9%.