Zip Codes with the Highest Percentage of Population Employed in Legal Services & Support in Punta Gorda, FL
RELATED REPORTS & OPTIONS
Legal Services & Support
Punta Gorda
Compare Zip Codes
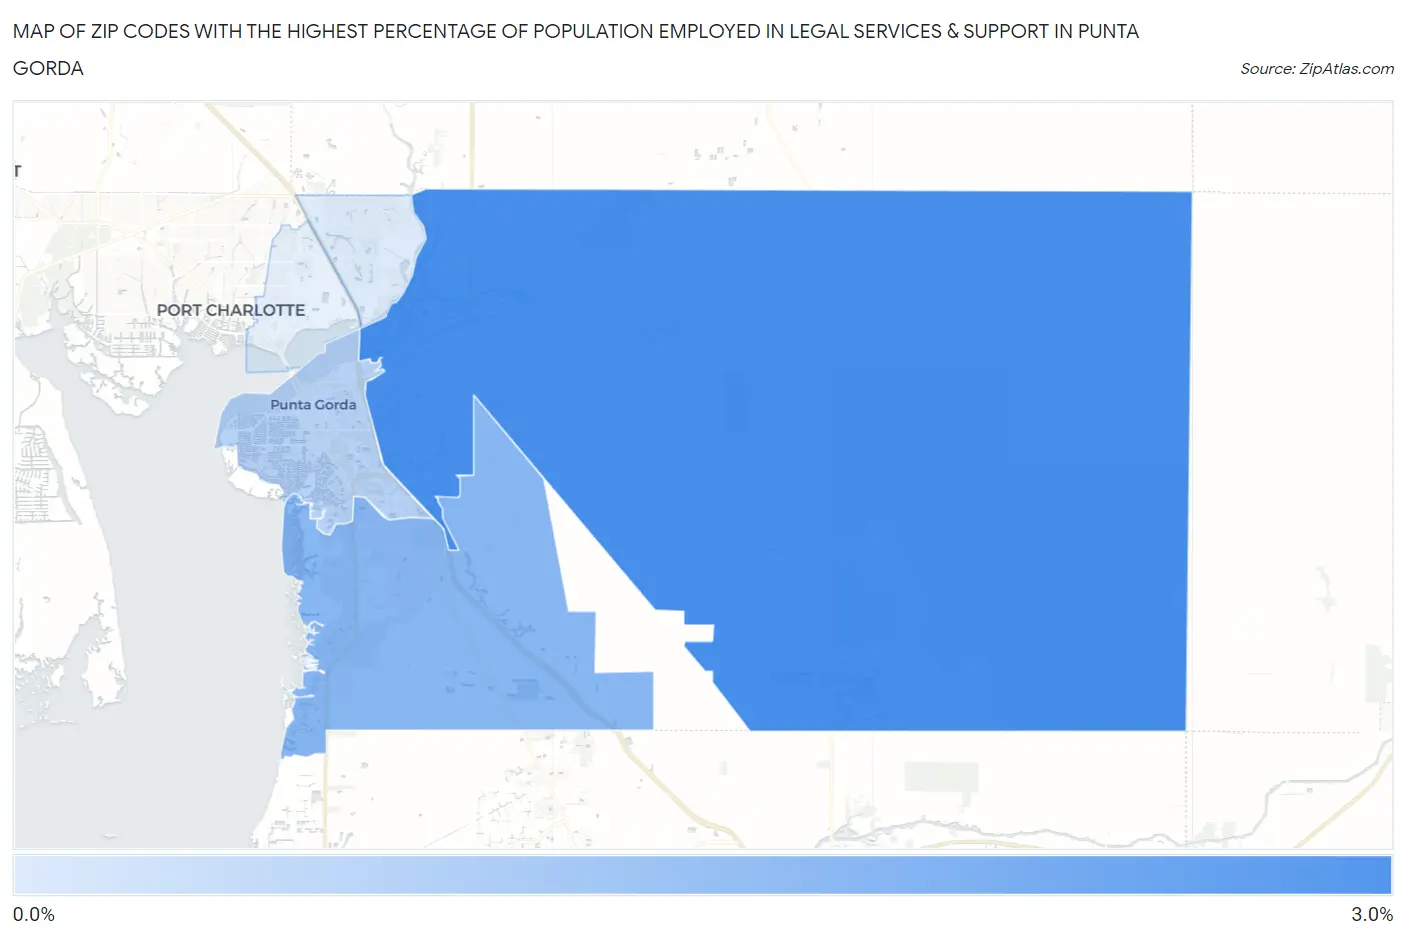
Map of Zip Codes with the Highest Percentage of Population Employed in Legal Services & Support in Punta Gorda
0.44%
2.9%
Zip Codes with the Highest Percentage of Population Employed in Legal Services & Support in Punta Gorda, FL
| Zip Code | % Employed | vs State | vs National | |
| 1. | 33982 | 2.9% | 1.3%(+1.57)#100 | 1.2%(+1.70)#1,985 |
| 2. | 33955 | 1.8% | 1.3%(+0.497)#198 | 1.2%(+0.630)#3,969 |
| 3. | 33950 | 1.1% | 1.3%(-0.264)#395 | 1.2%(-0.131)#7,475 |
| 4. | 33983 | 0.44% | 1.3%(-0.879)#665 | 1.2%(-0.746)#13,377 |
1
Common Questions
What are the Top 3 Zip Codes with the Highest Percentage of Population Employed in Legal Services & Support in Punta Gorda, FL?
Top 3 Zip Codes with the Highest Percentage of Population Employed in Legal Services & Support in Punta Gorda, FL are:
What zip code has the Highest Percentage of Population Employed in Legal Services & Support in Punta Gorda, FL?
33982 has the Highest Percentage of Population Employed in Legal Services & Support in Punta Gorda, FL with 2.9%.
What is the Percentage of Population Employed in Legal Services & Support in Punta Gorda, FL?
Percentage of Population Employed in Legal Services & Support in Punta Gorda is 1.6%.
What is the Percentage of Population Employed in Legal Services & Support in Florida?
Percentage of Population Employed in Legal Services & Support in Florida is 1.3%.
What is the Percentage of Population Employed in Legal Services & Support in the United States?
Percentage of Population Employed in Legal Services & Support in the United States is 1.2%.