Tlingit-Haida vs Lumbee Householder Income Under 25 years
COMPARE
Tlingit-Haida
Lumbee
Householder Income Under 25 years
Householder Income Under 25 years Comparison
Tlingit-Haida
Lumbee
$55,914
HOUSEHOLDER INCOME UNDER 25 YEARS
100.0/ 100
METRIC RATING
35th/ 347
METRIC RANK
$34,584
HOUSEHOLDER INCOME UNDER 25 YEARS
0.0/ 100
METRIC RATING
347th/ 347
METRIC RANK
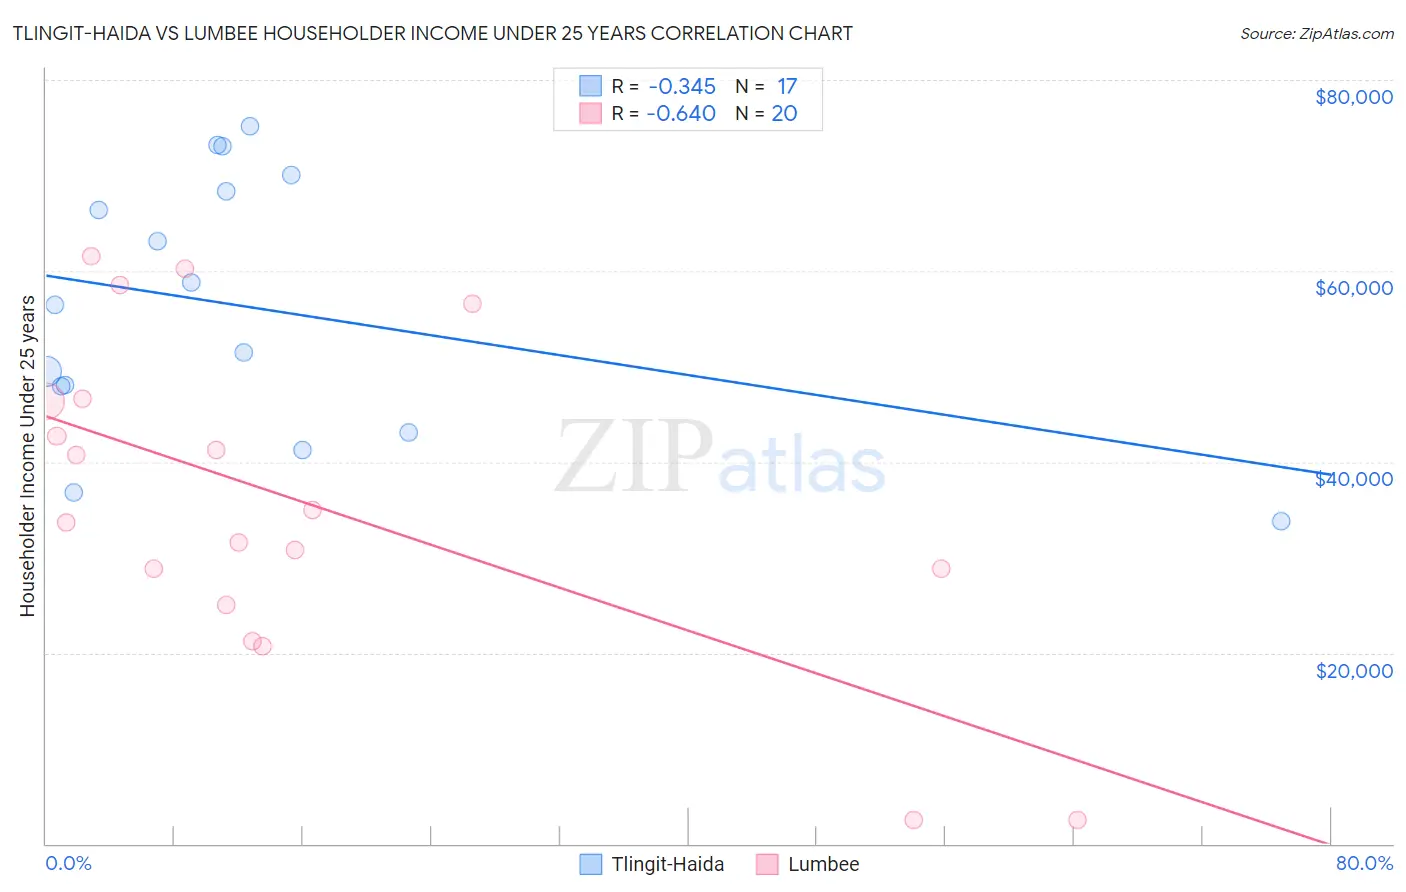
Tlingit-Haida vs Lumbee Householder Income Under 25 years Correlation Chart
The statistical analysis conducted on geographies consisting of 57,369,671 people shows a mild negative correlation between the proportion of Tlingit-Haida and household income with householder under the age of 25 in the United States with a correlation coefficient (R) of -0.345 and weighted average of $55,914. Similarly, the statistical analysis conducted on geographies consisting of 86,473,772 people shows a significant negative correlation between the proportion of Lumbee and household income with householder under the age of 25 in the United States with a correlation coefficient (R) of -0.640 and weighted average of $34,584, a difference of 61.7%.
Householder Income Under 25 years Correlation Summary
| Measurement | Tlingit-Haida | Lumbee |
| Minimum | $33,750 | $2,499 |
| Maximum | $75,104 | $61,485 |
| Range | $41,354 | $58,986 |
| Mean | $56,260 | $35,754 |
| Median | $56,462 | $34,331 |
| Interquartile 25% (IQ1) | $45,554 | $26,875 |
| Interquartile 75% (IQ3) | $69,196 | $46,497 |
| Interquartile Range (IQR) | $23,642 | $19,622 |
| Standard Deviation (Sample) | $13,469 | $16,953 |
| Standard Deviation (Population) | $13,067 | $16,524 |
Similar Demographics by Householder Income Under 25 years
Demographics Similar to Tlingit-Haida by Householder Income Under 25 years
In terms of householder income under 25 years, the demographic groups most similar to Tlingit-Haida are Immigrants from Israel ($55,913, a difference of 0.0%), Immigrants from Japan ($55,932, a difference of 0.030%), Inupiat ($55,935, a difference of 0.040%), Immigrants from Russia ($55,891, a difference of 0.040%), and Immigrants from Iran ($55,880, a difference of 0.060%).
| Demographics | Rating | Rank | Householder Income Under 25 years |
| Immigrants | Peru | 100.0 /100 | #28 | Exceptional $56,384 |
| Immigrants | Asia | 100.0 /100 | #29 | Exceptional $56,379 |
| Immigrants | Moldova | 100.0 /100 | #30 | Exceptional $56,168 |
| Vietnamese | 100.0 /100 | #31 | Exceptional $56,127 |
| Peruvians | 100.0 /100 | #32 | Exceptional $56,052 |
| Inupiat | 100.0 /100 | #33 | Exceptional $55,935 |
| Immigrants | Japan | 100.0 /100 | #34 | Exceptional $55,932 |
| Tlingit-Haida | 100.0 /100 | #35 | Exceptional $55,914 |
| Immigrants | Israel | 100.0 /100 | #36 | Exceptional $55,913 |
| Immigrants | Russia | 100.0 /100 | #37 | Exceptional $55,891 |
| Immigrants | Iran | 100.0 /100 | #38 | Exceptional $55,880 |
| Immigrants | Belarus | 100.0 /100 | #39 | Exceptional $55,743 |
| Immigrants | Greece | 100.0 /100 | #40 | Exceptional $55,727 |
| Immigrants | Guyana | 100.0 /100 | #41 | Exceptional $55,726 |
| Immigrants | Korea | 100.0 /100 | #42 | Exceptional $55,716 |
Demographics Similar to Lumbee by Householder Income Under 25 years
In terms of householder income under 25 years, the demographic groups most similar to Lumbee are Puerto Rican ($39,726, a difference of 14.9%), Navajo ($42,380, a difference of 22.5%), Immigrants from Congo ($43,266, a difference of 25.1%), Immigrants from Yemen ($43,591, a difference of 26.0%), and Arapaho ($44,003, a difference of 27.2%).
| Demographics | Rating | Rank | Householder Income Under 25 years |
| Creek | 0.0 /100 | #333 | Tragic $45,371 |
| Cajuns | 0.0 /100 | #334 | Tragic $45,338 |
| Cheyenne | 0.0 /100 | #335 | Tragic $45,275 |
| Tohono O'odham | 0.0 /100 | #336 | Tragic $45,248 |
| Pueblo | 0.0 /100 | #337 | Tragic $45,018 |
| Chickasaw | 0.0 /100 | #338 | Tragic $44,763 |
| Kiowa | 0.0 /100 | #339 | Tragic $44,733 |
| Blacks/African Americans | 0.0 /100 | #340 | Tragic $44,381 |
| Houma | 0.0 /100 | #341 | Tragic $44,356 |
| Arapaho | 0.0 /100 | #342 | Tragic $44,003 |
| Immigrants | Yemen | 0.0 /100 | #343 | Tragic $43,591 |
| Immigrants | Congo | 0.0 /100 | #344 | Tragic $43,266 |
| Navajo | 0.0 /100 | #345 | Tragic $42,380 |
| Puerto Ricans | 0.0 /100 | #346 | Tragic $39,726 |
| Lumbee | 0.0 /100 | #347 | Tragic $34,584 |