Tlingit-Haida vs Lumbee Unemployment Among Ages 45 to 54 years
COMPARE
Tlingit-Haida
Lumbee
Unemployment Among Ages 45 to 54 years
Unemployment Among Ages 45 to 54 years Comparison
Tlingit-Haida
Lumbee
4.7%
UNEMPLOYMENT AMONG AGES 45 TO 54 YEARS
2.3/ 100
METRIC RATING
236th/ 347
METRIC RANK
4.6%
UNEMPLOYMENT AMONG AGES 45 TO 54 YEARS
9.2/ 100
METRIC RATING
216th/ 347
METRIC RANK
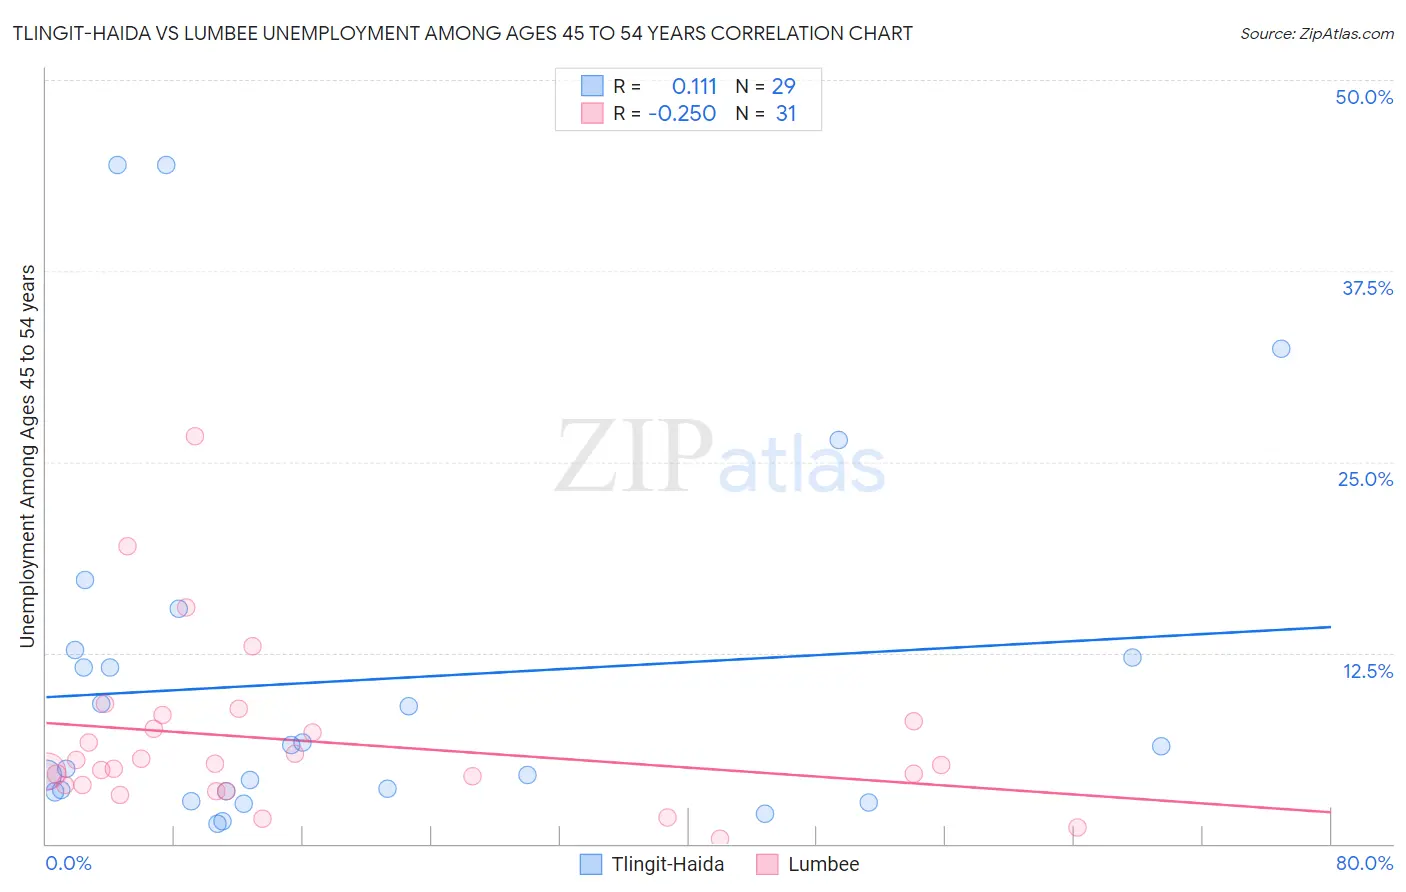
Tlingit-Haida vs Lumbee Unemployment Among Ages 45 to 54 years Correlation Chart
The statistical analysis conducted on geographies consisting of 60,127,685 people shows a poor positive correlation between the proportion of Tlingit-Haida and unemployment rate among population between the ages 45 and 54 in the United States with a correlation coefficient (R) of 0.111 and weighted average of 4.7%. Similarly, the statistical analysis conducted on geographies consisting of 91,020,578 people shows a weak negative correlation between the proportion of Lumbee and unemployment rate among population between the ages 45 and 54 in the United States with a correlation coefficient (R) of -0.250 and weighted average of 4.6%, a difference of 1.7%.
Unemployment Among Ages 45 to 54 years Correlation Summary
| Measurement | Tlingit-Haida | Lumbee |
| Minimum | 1.3% | 0.30% |
| Maximum | 44.4% | 26.7% |
| Range | 43.1% | 26.4% |
| Mean | 10.7% | 6.7% |
| Median | 6.4% | 5.1% |
| Interquartile 25% (IQ1) | 3.4% | 3.8% |
| Interquartile 75% (IQ3) | 12.4% | 8.0% |
| Interquartile Range (IQR) | 9.0% | 4.2% |
| Standard Deviation (Sample) | 11.8% | 5.5% |
| Standard Deviation (Population) | 11.6% | 5.4% |
Demographics Similar to Tlingit-Haida and Lumbee by Unemployment Among Ages 45 to 54 years
In terms of unemployment among ages 45 to 54 years, the demographic groups most similar to Tlingit-Haida are Cree (4.7%, a difference of 0.010%), Soviet Union (4.7%, a difference of 0.16%), Immigrants (4.7%, a difference of 0.18%), Ottawa (4.7%, a difference of 0.21%), and Immigrants from Ireland (4.7%, a difference of 0.22%). Similarly, the demographic groups most similar to Lumbee are Immigrants from Cambodia (4.7%, a difference of 0.27%), Immigrants from Uganda (4.7%, a difference of 0.31%), Nigerian (4.7%, a difference of 0.35%), Guamanian/Chamorro (4.7%, a difference of 0.37%), and Choctaw (4.7%, a difference of 0.50%).
| Demographics | Rating | Rank | Unemployment Among Ages 45 to 54 years |
| Lumbee | 9.2 /100 | #216 | Tragic 4.6% |
| Immigrants | Cambodia | 7.4 /100 | #217 | Tragic 4.7% |
| Immigrants | Uganda | 7.1 /100 | #218 | Tragic 4.7% |
| Nigerians | 7.0 /100 | #219 | Tragic 4.7% |
| Guamanians/Chamorros | 6.8 /100 | #220 | Tragic 4.7% |
| Choctaw | 6.1 /100 | #221 | Tragic 4.7% |
| Immigrants | Southern Europe | 6.0 /100 | #222 | Tragic 4.7% |
| Potawatomi | 5.7 /100 | #223 | Tragic 4.7% |
| Comanche | 4.8 /100 | #224 | Tragic 4.7% |
| Immigrants | Norway | 4.8 /100 | #225 | Tragic 4.7% |
| Assyrians/Chaldeans/Syriacs | 3.5 /100 | #226 | Tragic 4.7% |
| Iraqis | 3.2 /100 | #227 | Tragic 4.7% |
| South American Indians | 3.1 /100 | #228 | Tragic 4.7% |
| Immigrants | Israel | 3.0 /100 | #229 | Tragic 4.7% |
| Japanese | 2.8 /100 | #230 | Tragic 4.7% |
| Immigrants | Ireland | 2.7 /100 | #231 | Tragic 4.7% |
| Ottawa | 2.7 /100 | #232 | Tragic 4.7% |
| Immigrants | Immigrants | 2.6 /100 | #233 | Tragic 4.7% |
| Soviet Union | 2.6 /100 | #234 | Tragic 4.7% |
| Cree | 2.3 /100 | #235 | Tragic 4.7% |
| Tlingit-Haida | 2.3 /100 | #236 | Tragic 4.7% |