Tlingit-Haida vs Zimbabwean Births to Unmarried Women
COMPARE
Tlingit-Haida
Zimbabwean
Births to Unmarried Women
Births to Unmarried Women Comparison
Tlingit-Haida
Zimbabweans
32.2%
BIRTHS TO UNMARRIED WOMEN
32.6/ 100
METRIC RATING
190th/ 347
METRIC RANK
28.7%
BIRTHS TO UNMARRIED WOMEN
98.2/ 100
METRIC RATING
78th/ 347
METRIC RANK
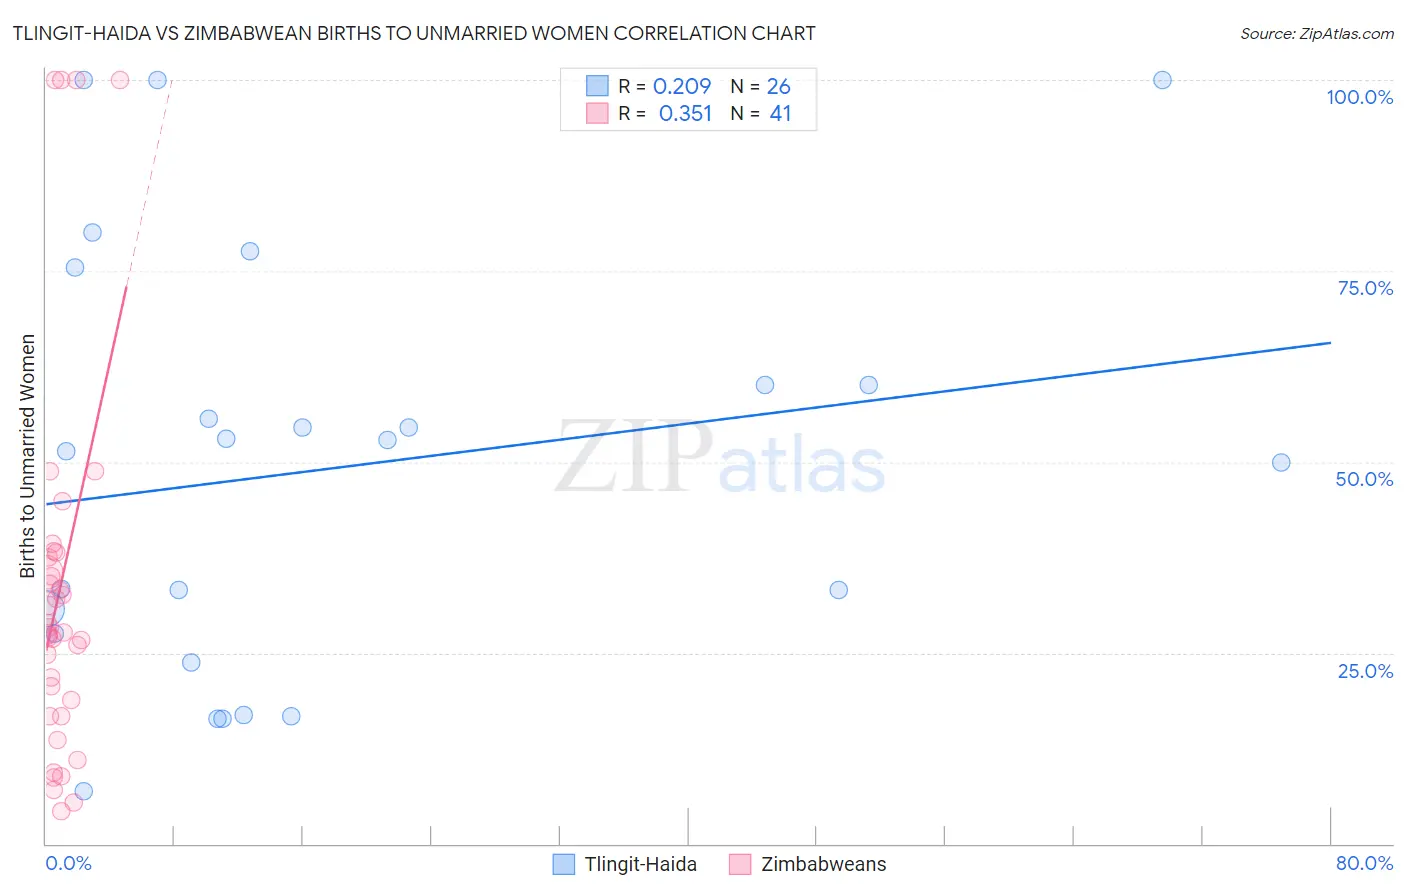
Tlingit-Haida vs Zimbabwean Births to Unmarried Women Correlation Chart
The statistical analysis conducted on geographies consisting of 59,376,059 people shows a weak positive correlation between the proportion of Tlingit-Haida and percentage of births to unmarried women in the United States with a correlation coefficient (R) of 0.209 and weighted average of 32.2%. Similarly, the statistical analysis conducted on geographies consisting of 68,374,099 people shows a mild positive correlation between the proportion of Zimbabweans and percentage of births to unmarried women in the United States with a correlation coefficient (R) of 0.351 and weighted average of 28.7%, a difference of 12.3%.
Births to Unmarried Women Correlation Summary
| Measurement | Tlingit-Haida | Zimbabwean |
| Minimum | 6.9% | 4.3% |
| Maximum | 100.0% | 100.0% |
| Range | 93.1% | 95.7% |
| Mean | 49.2% | 33.3% |
| Median | 52.2% | 27.6% |
| Interquartile 25% (IQ1) | 27.6% | 17.8% |
| Interquartile 75% (IQ3) | 60.0% | 37.9% |
| Interquartile Range (IQR) | 32.4% | 20.1% |
| Standard Deviation (Sample) | 27.4% | 25.0% |
| Standard Deviation (Population) | 26.9% | 24.7% |
Similar Demographics by Births to Unmarried Women
Demographics Similar to Tlingit-Haida by Births to Unmarried Women
In terms of births to unmarried women, the demographic groups most similar to Tlingit-Haida are Irish (32.2%, a difference of 0.020%), Colombian (32.2%, a difference of 0.080%), Fijian (32.3%, a difference of 0.17%), Immigrants from Kenya (32.1%, a difference of 0.44%), and Osage (32.1%, a difference of 0.47%).
| Demographics | Rating | Rank | Births to Unmarried Women |
| Canadians | 41.4 /100 | #183 | Average 31.9% |
| Immigrants | South America | 40.7 /100 | #184 | Average 32.0% |
| Germans | 39.5 /100 | #185 | Fair 32.0% |
| Welsh | 38.2 /100 | #186 | Fair 32.0% |
| Czechoslovakians | 38.0 /100 | #187 | Fair 32.0% |
| Osage | 37.1 /100 | #188 | Fair 32.1% |
| Immigrants | Kenya | 36.9 /100 | #189 | Fair 32.1% |
| Tlingit-Haida | 32.6 /100 | #190 | Fair 32.2% |
| Irish | 32.4 /100 | #191 | Fair 32.2% |
| Colombians | 31.9 /100 | #192 | Fair 32.2% |
| Fijians | 31.1 /100 | #193 | Fair 32.3% |
| Sudanese | 27.3 /100 | #194 | Fair 32.4% |
| Samoans | 21.9 /100 | #195 | Fair 32.6% |
| Immigrants | Colombia | 21.7 /100 | #196 | Fair 32.6% |
| Immigrants | Immigrants | 20.6 /100 | #197 | Fair 32.7% |
Demographics Similar to Zimbabweans by Births to Unmarried Women
In terms of births to unmarried women, the demographic groups most similar to Zimbabweans are Danish (28.7%, a difference of 0.020%), Immigrants from Afghanistan (28.7%, a difference of 0.050%), Immigrants from Austria (28.7%, a difference of 0.090%), Immigrants from Northern Europe (28.6%, a difference of 0.16%), and Romanian (28.7%, a difference of 0.20%).
| Demographics | Rating | Rank | Births to Unmarried Women |
| Jordanians | 98.5 /100 | #71 | Exceptional 28.5% |
| Immigrants | Sweden | 98.5 /100 | #72 | Exceptional 28.5% |
| Albanians | 98.5 /100 | #73 | Exceptional 28.5% |
| Immigrants | Bolivia | 98.5 /100 | #74 | Exceptional 28.6% |
| Immigrants | Switzerland | 98.4 /100 | #75 | Exceptional 28.6% |
| Israelis | 98.4 /100 | #76 | Exceptional 28.6% |
| Immigrants | Northern Europe | 98.3 /100 | #77 | Exceptional 28.6% |
| Zimbabweans | 98.2 /100 | #78 | Exceptional 28.7% |
| Danes | 98.2 /100 | #79 | Exceptional 28.7% |
| Immigrants | Afghanistan | 98.1 /100 | #80 | Exceptional 28.7% |
| Immigrants | Austria | 98.1 /100 | #81 | Exceptional 28.7% |
| Romanians | 98.0 /100 | #82 | Exceptional 28.7% |
| Immigrants | Kuwait | 98.0 /100 | #83 | Exceptional 28.8% |
| Immigrants | Poland | 97.6 /100 | #84 | Exceptional 28.9% |
| Sri Lankans | 97.5 /100 | #85 | Exceptional 28.9% |