Tlingit-Haida vs Immigrants from Iran Births to Unmarried Women
COMPARE
Tlingit-Haida
Immigrants from Iran
Births to Unmarried Women
Births to Unmarried Women Comparison
Tlingit-Haida
Immigrants from Iran
32.2%
BIRTHS TO UNMARRIED WOMEN
32.6/ 100
METRIC RATING
190th/ 347
METRIC RANK
24.0%
BIRTHS TO UNMARRIED WOMEN
100.0/ 100
METRIC RATING
6th/ 347
METRIC RANK
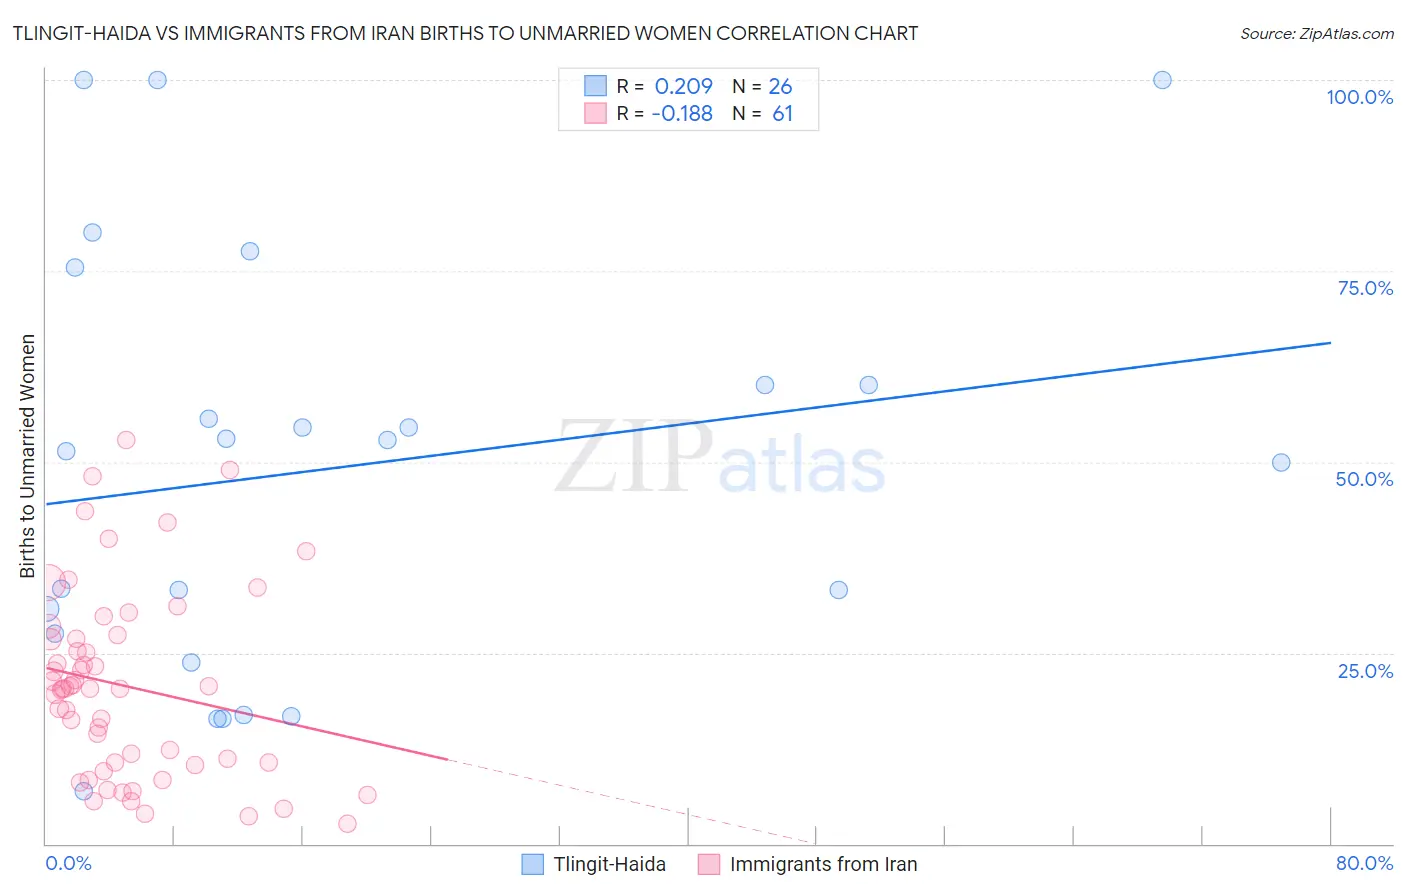
Tlingit-Haida vs Immigrants from Iran Births to Unmarried Women Correlation Chart
The statistical analysis conducted on geographies consisting of 59,376,059 people shows a weak positive correlation between the proportion of Tlingit-Haida and percentage of births to unmarried women in the United States with a correlation coefficient (R) of 0.209 and weighted average of 32.2%. Similarly, the statistical analysis conducted on geographies consisting of 263,743,481 people shows a poor negative correlation between the proportion of Immigrants from Iran and percentage of births to unmarried women in the United States with a correlation coefficient (R) of -0.188 and weighted average of 24.0%, a difference of 34.5%.
Births to Unmarried Women Correlation Summary
| Measurement | Tlingit-Haida | Immigrants from Iran |
| Minimum | 6.9% | 2.7% |
| Maximum | 100.0% | 52.8% |
| Range | 93.1% | 50.1% |
| Mean | 49.2% | 20.6% |
| Median | 52.2% | 20.3% |
| Interquartile 25% (IQ1) | 27.6% | 10.4% |
| Interquartile 75% (IQ3) | 60.0% | 27.1% |
| Interquartile Range (IQR) | 32.4% | 16.6% |
| Standard Deviation (Sample) | 27.4% | 12.2% |
| Standard Deviation (Population) | 26.9% | 12.1% |
Similar Demographics by Births to Unmarried Women
Demographics Similar to Tlingit-Haida by Births to Unmarried Women
In terms of births to unmarried women, the demographic groups most similar to Tlingit-Haida are Irish (32.2%, a difference of 0.020%), Colombian (32.2%, a difference of 0.080%), Fijian (32.3%, a difference of 0.17%), Immigrants from Kenya (32.1%, a difference of 0.44%), and Osage (32.1%, a difference of 0.47%).
| Demographics | Rating | Rank | Births to Unmarried Women |
| Canadians | 41.4 /100 | #183 | Average 31.9% |
| Immigrants | South America | 40.7 /100 | #184 | Average 32.0% |
| Germans | 39.5 /100 | #185 | Fair 32.0% |
| Welsh | 38.2 /100 | #186 | Fair 32.0% |
| Czechoslovakians | 38.0 /100 | #187 | Fair 32.0% |
| Osage | 37.1 /100 | #188 | Fair 32.1% |
| Immigrants | Kenya | 36.9 /100 | #189 | Fair 32.1% |
| Tlingit-Haida | 32.6 /100 | #190 | Fair 32.2% |
| Irish | 32.4 /100 | #191 | Fair 32.2% |
| Colombians | 31.9 /100 | #192 | Fair 32.2% |
| Fijians | 31.1 /100 | #193 | Fair 32.3% |
| Sudanese | 27.3 /100 | #194 | Fair 32.4% |
| Samoans | 21.9 /100 | #195 | Fair 32.6% |
| Immigrants | Colombia | 21.7 /100 | #196 | Fair 32.6% |
| Immigrants | Immigrants | 20.6 /100 | #197 | Fair 32.7% |
Demographics Similar to Immigrants from Iran by Births to Unmarried Women
In terms of births to unmarried women, the demographic groups most similar to Immigrants from Iran are Thai (24.0%, a difference of 0.29%), Immigrants from Hong Kong (23.6%, a difference of 1.6%), Immigrants from China (24.7%, a difference of 3.0%), Immigrants from South Central Asia (24.7%, a difference of 3.0%), and Immigrants from Taiwan (23.0%, a difference of 4.1%).
| Demographics | Rating | Rank | Births to Unmarried Women |
| Assyrians/Chaldeans/Syriacs | 100.0 /100 | #1 | Exceptional 22.0% |
| Immigrants | India | 100.0 /100 | #2 | Exceptional 22.9% |
| Filipinos | 100.0 /100 | #3 | Exceptional 23.0% |
| Immigrants | Taiwan | 100.0 /100 | #4 | Exceptional 23.0% |
| Immigrants | Hong Kong | 100.0 /100 | #5 | Exceptional 23.6% |
| Immigrants | Iran | 100.0 /100 | #6 | Exceptional 24.0% |
| Thais | 100.0 /100 | #7 | Exceptional 24.0% |
| Immigrants | China | 100.0 /100 | #8 | Exceptional 24.7% |
| Immigrants | South Central Asia | 100.0 /100 | #9 | Exceptional 24.7% |
| Immigrants | Eastern Asia | 100.0 /100 | #10 | Exceptional 25.0% |
| Immigrants | Israel | 100.0 /100 | #11 | Exceptional 25.1% |
| Indians (Asian) | 100.0 /100 | #12 | Exceptional 25.3% |
| Iranians | 100.0 /100 | #13 | Exceptional 25.3% |
| Immigrants | Lebanon | 100.0 /100 | #14 | Exceptional 25.3% |
| Immigrants | Singapore | 100.0 /100 | #15 | Exceptional 25.6% |