Tlingit-Haida vs Belgian Births to Unmarried Women
COMPARE
Tlingit-Haida
Belgian
Births to Unmarried Women
Births to Unmarried Women Comparison
Tlingit-Haida
Belgians
32.2%
BIRTHS TO UNMARRIED WOMEN
32.6/ 100
METRIC RATING
190th/ 347
METRIC RANK
31.6%
BIRTHS TO UNMARRIED WOMEN
52.4/ 100
METRIC RATING
168th/ 347
METRIC RANK
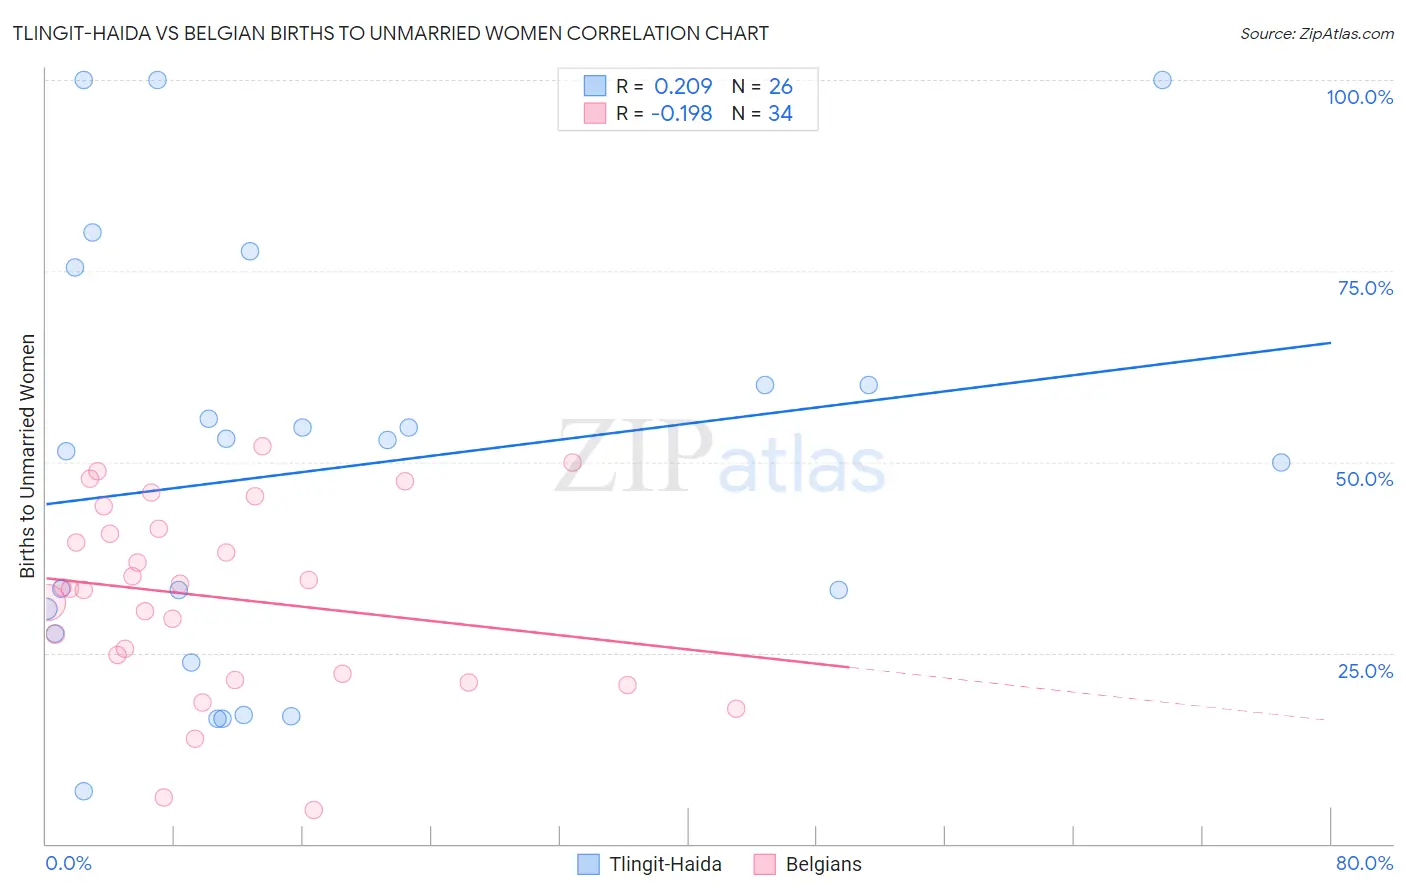
Tlingit-Haida vs Belgian Births to Unmarried Women Correlation Chart
The statistical analysis conducted on geographies consisting of 59,376,059 people shows a weak positive correlation between the proportion of Tlingit-Haida and percentage of births to unmarried women in the United States with a correlation coefficient (R) of 0.209 and weighted average of 32.2%. Similarly, the statistical analysis conducted on geographies consisting of 329,841,435 people shows a poor negative correlation between the proportion of Belgians and percentage of births to unmarried women in the United States with a correlation coefficient (R) of -0.198 and weighted average of 31.6%, a difference of 1.9%.
Births to Unmarried Women Correlation Summary
| Measurement | Tlingit-Haida | Belgian |
| Minimum | 6.9% | 4.4% |
| Maximum | 100.0% | 52.0% |
| Range | 93.1% | 47.6% |
| Mean | 49.2% | 32.3% |
| Median | 52.2% | 33.5% |
| Interquartile 25% (IQ1) | 27.6% | 22.3% |
| Interquartile 75% (IQ3) | 60.0% | 41.2% |
| Interquartile Range (IQR) | 32.4% | 19.0% |
| Standard Deviation (Sample) | 27.4% | 12.4% |
| Standard Deviation (Population) | 26.9% | 12.2% |
Similar Demographics by Births to Unmarried Women
Demographics Similar to Tlingit-Haida by Births to Unmarried Women
In terms of births to unmarried women, the demographic groups most similar to Tlingit-Haida are Irish (32.2%, a difference of 0.020%), Colombian (32.2%, a difference of 0.080%), Fijian (32.3%, a difference of 0.17%), Immigrants from Kenya (32.1%, a difference of 0.44%), and Osage (32.1%, a difference of 0.47%).
| Demographics | Rating | Rank | Births to Unmarried Women |
| Canadians | 41.4 /100 | #183 | Average 31.9% |
| Immigrants | South America | 40.7 /100 | #184 | Average 32.0% |
| Germans | 39.5 /100 | #185 | Fair 32.0% |
| Welsh | 38.2 /100 | #186 | Fair 32.0% |
| Czechoslovakians | 38.0 /100 | #187 | Fair 32.0% |
| Osage | 37.1 /100 | #188 | Fair 32.1% |
| Immigrants | Kenya | 36.9 /100 | #189 | Fair 32.1% |
| Tlingit-Haida | 32.6 /100 | #190 | Fair 32.2% |
| Irish | 32.4 /100 | #191 | Fair 32.2% |
| Colombians | 31.9 /100 | #192 | Fair 32.2% |
| Fijians | 31.1 /100 | #193 | Fair 32.3% |
| Sudanese | 27.3 /100 | #194 | Fair 32.4% |
| Samoans | 21.9 /100 | #195 | Fair 32.6% |
| Immigrants | Colombia | 21.7 /100 | #196 | Fair 32.6% |
| Immigrants | Immigrants | 20.6 /100 | #197 | Fair 32.7% |
Demographics Similar to Belgians by Births to Unmarried Women
In terms of births to unmarried women, the demographic groups most similar to Belgians are Slavic (31.6%, a difference of 0.030%), Guamanian/Chamorro (31.6%, a difference of 0.10%), Finnish (31.7%, a difference of 0.18%), Immigrants from Eritrea (31.7%, a difference of 0.19%), and Immigrants from Yemen (31.7%, a difference of 0.20%).
| Demographics | Rating | Rank | Births to Unmarried Women |
| Immigrants | Southern Europe | 68.7 /100 | #161 | Good 31.1% |
| Slovenes | 65.9 /100 | #162 | Good 31.2% |
| Immigrants | Chile | 65.7 /100 | #163 | Good 31.2% |
| Hungarians | 64.1 /100 | #164 | Good 31.2% |
| Immigrants | Somalia | 58.1 /100 | #165 | Average 31.4% |
| Peruvians | 55.5 /100 | #166 | Average 31.5% |
| Dutch | 55.3 /100 | #167 | Average 31.5% |
| Belgians | 52.4 /100 | #168 | Average 31.6% |
| Slavs | 52.0 /100 | #169 | Average 31.6% |
| Guamanians/Chamorros | 51.3 /100 | #170 | Average 31.6% |
| Finns | 50.5 /100 | #171 | Average 31.7% |
| Immigrants | Eritrea | 50.4 /100 | #172 | Average 31.7% |
| Immigrants | Yemen | 50.2 /100 | #173 | Average 31.7% |
| Venezuelans | 50.0 /100 | #174 | Average 31.7% |
| Immigrants | Venezuela | 49.2 /100 | #175 | Average 31.7% |