Tlingit-Haida vs Immigrants from Italy Births to Unmarried Women
COMPARE
Tlingit-Haida
Immigrants from Italy
Births to Unmarried Women
Births to Unmarried Women Comparison
Tlingit-Haida
Immigrants from Italy
32.2%
BIRTHS TO UNMARRIED WOMEN
32.6/ 100
METRIC RATING
190th/ 347
METRIC RANK
29.9%
BIRTHS TO UNMARRIED WOMEN
91.7/ 100
METRIC RATING
116th/ 347
METRIC RANK
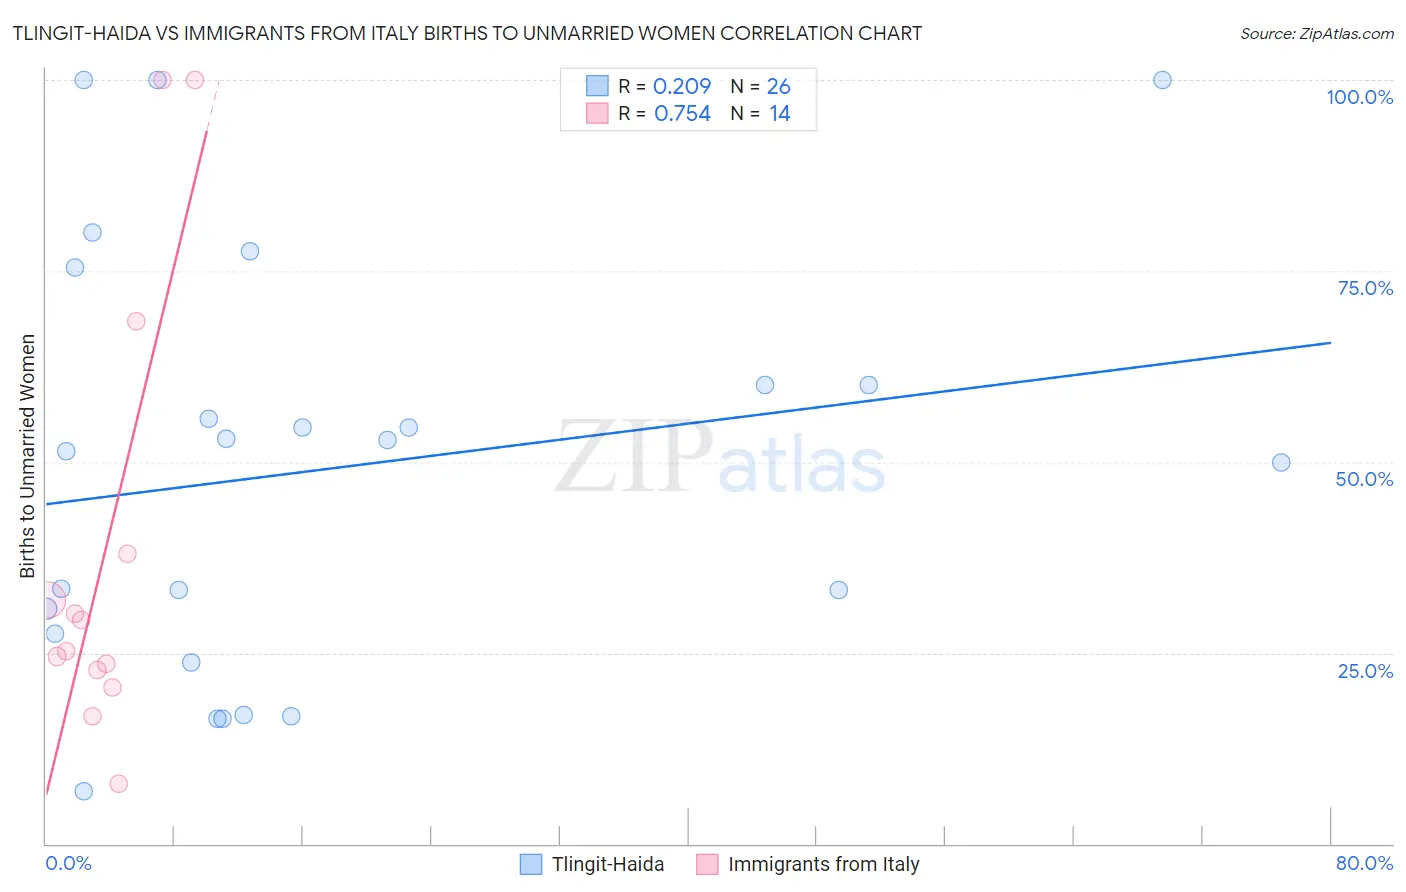
Tlingit-Haida vs Immigrants from Italy Births to Unmarried Women Correlation Chart
The statistical analysis conducted on geographies consisting of 59,376,059 people shows a weak positive correlation between the proportion of Tlingit-Haida and percentage of births to unmarried women in the United States with a correlation coefficient (R) of 0.209 and weighted average of 32.2%. Similarly, the statistical analysis conducted on geographies consisting of 300,581,400 people shows a strong positive correlation between the proportion of Immigrants from Italy and percentage of births to unmarried women in the United States with a correlation coefficient (R) of 0.754 and weighted average of 29.9%, a difference of 7.8%.
Births to Unmarried Women Correlation Summary
| Measurement | Tlingit-Haida | Immigrants from Italy |
| Minimum | 6.9% | 7.9% |
| Maximum | 100.0% | 100.0% |
| Range | 93.1% | 92.1% |
| Mean | 49.2% | 38.5% |
| Median | 52.2% | 27.2% |
| Interquartile 25% (IQ1) | 27.6% | 22.8% |
| Interquartile 75% (IQ3) | 60.0% | 38.0% |
| Interquartile Range (IQR) | 32.4% | 15.2% |
| Standard Deviation (Sample) | 27.4% | 29.4% |
| Standard Deviation (Population) | 26.9% | 28.3% |
Similar Demographics by Births to Unmarried Women
Demographics Similar to Tlingit-Haida by Births to Unmarried Women
In terms of births to unmarried women, the demographic groups most similar to Tlingit-Haida are Irish (32.2%, a difference of 0.020%), Colombian (32.2%, a difference of 0.080%), Fijian (32.3%, a difference of 0.17%), Immigrants from Kenya (32.1%, a difference of 0.44%), and Osage (32.1%, a difference of 0.47%).
| Demographics | Rating | Rank | Births to Unmarried Women |
| Canadians | 41.4 /100 | #183 | Average 31.9% |
| Immigrants | South America | 40.7 /100 | #184 | Average 32.0% |
| Germans | 39.5 /100 | #185 | Fair 32.0% |
| Welsh | 38.2 /100 | #186 | Fair 32.0% |
| Czechoslovakians | 38.0 /100 | #187 | Fair 32.0% |
| Osage | 37.1 /100 | #188 | Fair 32.1% |
| Immigrants | Kenya | 36.9 /100 | #189 | Fair 32.1% |
| Tlingit-Haida | 32.6 /100 | #190 | Fair 32.2% |
| Irish | 32.4 /100 | #191 | Fair 32.2% |
| Colombians | 31.9 /100 | #192 | Fair 32.2% |
| Fijians | 31.1 /100 | #193 | Fair 32.3% |
| Sudanese | 27.3 /100 | #194 | Fair 32.4% |
| Samoans | 21.9 /100 | #195 | Fair 32.6% |
| Immigrants | Colombia | 21.7 /100 | #196 | Fair 32.6% |
| Immigrants | Immigrants | 20.6 /100 | #197 | Fair 32.7% |
Demographics Similar to Immigrants from Italy by Births to Unmarried Women
In terms of births to unmarried women, the demographic groups most similar to Immigrants from Italy are Ethiopian (29.8%, a difference of 0.080%), Immigrants from Netherlands (29.9%, a difference of 0.21%), Immigrants from Norway (29.9%, a difference of 0.23%), Immigrants from Croatia (29.8%, a difference of 0.30%), and Scandinavian (29.8%, a difference of 0.36%).
| Demographics | Rating | Rank | Births to Unmarried Women |
| Greeks | 93.4 /100 | #109 | Exceptional 29.7% |
| Immigrants | Ethiopia | 93.4 /100 | #110 | Exceptional 29.7% |
| Immigrants | Hungary | 93.0 /100 | #111 | Exceptional 29.7% |
| Basques | 93.0 /100 | #112 | Exceptional 29.7% |
| Scandinavians | 92.7 /100 | #113 | Exceptional 29.8% |
| Immigrants | Croatia | 92.6 /100 | #114 | Exceptional 29.8% |
| Ethiopians | 91.9 /100 | #115 | Exceptional 29.8% |
| Immigrants | Italy | 91.7 /100 | #116 | Exceptional 29.9% |
| Immigrants | Netherlands | 91.1 /100 | #117 | Exceptional 29.9% |
| Immigrants | Norway | 91.0 /100 | #118 | Exceptional 29.9% |
| Argentineans | 90.5 /100 | #119 | Exceptional 30.0% |
| Ugandans | 89.2 /100 | #120 | Excellent 30.1% |
| Koreans | 88.9 /100 | #121 | Excellent 30.1% |
| Immigrants | Argentina | 88.7 /100 | #122 | Excellent 30.1% |
| Syrians | 88.2 /100 | #123 | Excellent 30.2% |