Sri Lankan vs Chinese Married-couple Households
COMPARE
Sri Lankan
Chinese
Married-couple Households
Married-couple Households Comparison
Sri Lankans
Chinese
49.0%
MARRIED-COUPLE HOUSEHOLDS
99.7/ 100
METRIC RATING
37th/ 347
METRIC RANK
50.4%
MARRIED-COUPLE HOUSEHOLDS
100.0/ 100
METRIC RATING
10th/ 347
METRIC RANK
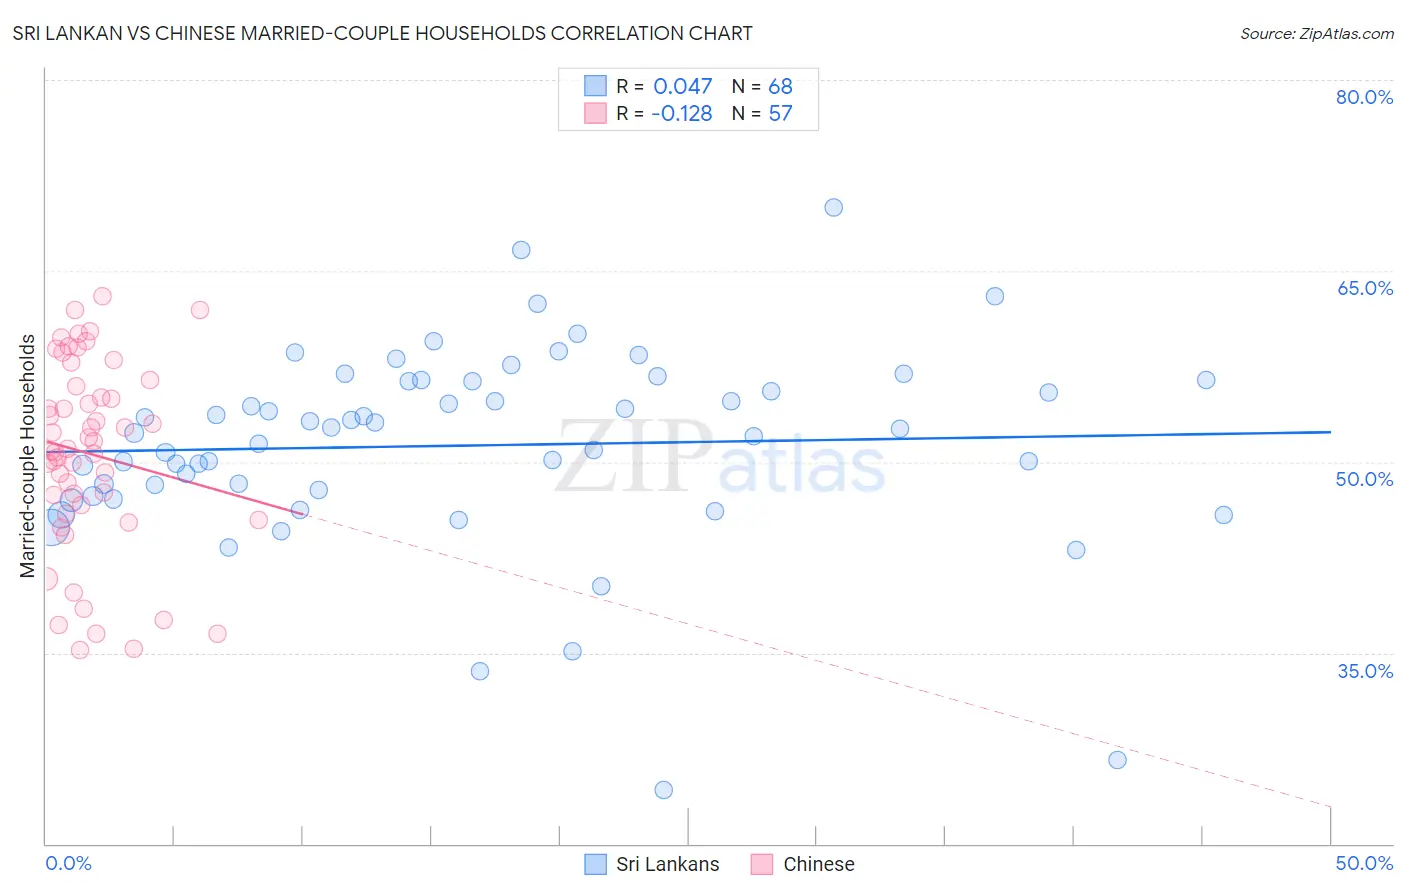
Sri Lankan vs Chinese Married-couple Households Correlation Chart
The statistical analysis conducted on geographies consisting of 440,079,035 people shows no correlation between the proportion of Sri Lankans and percentage of married-couple family households in the United States with a correlation coefficient (R) of 0.047 and weighted average of 49.0%. Similarly, the statistical analysis conducted on geographies consisting of 64,801,742 people shows a poor negative correlation between the proportion of Chinese and percentage of married-couple family households in the United States with a correlation coefficient (R) of -0.128 and weighted average of 50.4%, a difference of 2.8%.
Married-couple Households Correlation Summary
| Measurement | Sri Lankan | Chinese |
| Minimum | 24.2% | 35.3% |
| Maximum | 70.0% | 63.0% |
| Range | 45.7% | 27.8% |
| Mean | 51.3% | 50.6% |
| Median | 52.4% | 51.0% |
| Interquartile 25% (IQ1) | 47.6% | 46.3% |
| Interquartile 75% (IQ3) | 56.4% | 56.2% |
| Interquartile Range (IQR) | 8.8% | 9.9% |
| Standard Deviation (Sample) | 7.8% | 7.4% |
| Standard Deviation (Population) | 7.7% | 7.4% |
Similar Demographics by Married-couple Households
Demographics Similar to Sri Lankans by Married-couple Households
In terms of married-couple households, the demographic groups most similar to Sri Lankans are Iranian (49.0%, a difference of 0.0%), Scottish (49.0%, a difference of 0.090%), Greek (48.9%, a difference of 0.090%), Italian (49.0%, a difference of 0.11%), and Lithuanian (48.9%, a difference of 0.18%).
| Demographics | Rating | Rank | Married-couple Households |
| Bolivians | 99.8 /100 | #30 | Exceptional 49.2% |
| Native Hawaiians | 99.8 /100 | #31 | Exceptional 49.1% |
| Hungarians | 99.8 /100 | #32 | Exceptional 49.1% |
| Immigrants | Asia | 99.7 /100 | #33 | Exceptional 49.1% |
| Italians | 99.7 /100 | #34 | Exceptional 49.0% |
| Scottish | 99.7 /100 | #35 | Exceptional 49.0% |
| Iranians | 99.7 /100 | #36 | Exceptional 49.0% |
| Sri Lankans | 99.7 /100 | #37 | Exceptional 49.0% |
| Greeks | 99.7 /100 | #38 | Exceptional 48.9% |
| Lithuanians | 99.6 /100 | #39 | Exceptional 48.9% |
| Immigrants | Bolivia | 99.6 /100 | #40 | Exceptional 48.9% |
| Immigrants | Lebanon | 99.6 /100 | #41 | Exceptional 48.9% |
| Immigrants | Vietnam | 99.6 /100 | #42 | Exceptional 48.8% |
| Immigrants | Iran | 99.6 /100 | #43 | Exceptional 48.8% |
| Welsh | 99.5 /100 | #44 | Exceptional 48.8% |
Demographics Similar to Chinese by Married-couple Households
In terms of married-couple households, the demographic groups most similar to Chinese are Pennsylvania German (50.4%, a difference of 0.0%), Immigrants from Pakistan (50.1%, a difference of 0.44%), Immigrants from South Central Asia (50.6%, a difference of 0.55%), Swiss (49.9%, a difference of 0.81%), and Immigrants from Korea (49.9%, a difference of 0.98%).
| Demographics | Rating | Rank | Married-couple Households |
| Thais | 100.0 /100 | #3 | Exceptional 51.9% |
| Assyrians/Chaldeans/Syriacs | 100.0 /100 | #4 | Exceptional 51.8% |
| Tongans | 100.0 /100 | #5 | Exceptional 51.6% |
| Danes | 100.0 /100 | #6 | Exceptional 51.1% |
| Filipinos | 100.0 /100 | #7 | Exceptional 51.0% |
| Immigrants | South Central Asia | 100.0 /100 | #8 | Exceptional 50.6% |
| Pennsylvania Germans | 100.0 /100 | #9 | Exceptional 50.4% |
| Chinese | 100.0 /100 | #10 | Exceptional 50.4% |
| Immigrants | Pakistan | 100.0 /100 | #11 | Exceptional 50.1% |
| Swiss | 100.0 /100 | #12 | Exceptional 49.9% |
| Immigrants | Korea | 100.0 /100 | #13 | Exceptional 49.9% |
| Burmese | 100.0 /100 | #14 | Exceptional 49.8% |
| Koreans | 99.9 /100 | #15 | Exceptional 49.7% |
| Swedes | 99.9 /100 | #16 | Exceptional 49.7% |
| Immigrants | Hong Kong | 99.9 /100 | #17 | Exceptional 49.6% |