Sri Lankan vs Ghanaian Married-couple Households
COMPARE
Sri Lankan
Ghanaian
Married-couple Households
Married-couple Households Comparison
Sri Lankans
Ghanaians
49.0%
MARRIED-COUPLE HOUSEHOLDS
99.7/ 100
METRIC RATING
37th/ 347
METRIC RANK
42.2%
MARRIED-COUPLE HOUSEHOLDS
0.0/ 100
METRIC RATING
285th/ 347
METRIC RANK
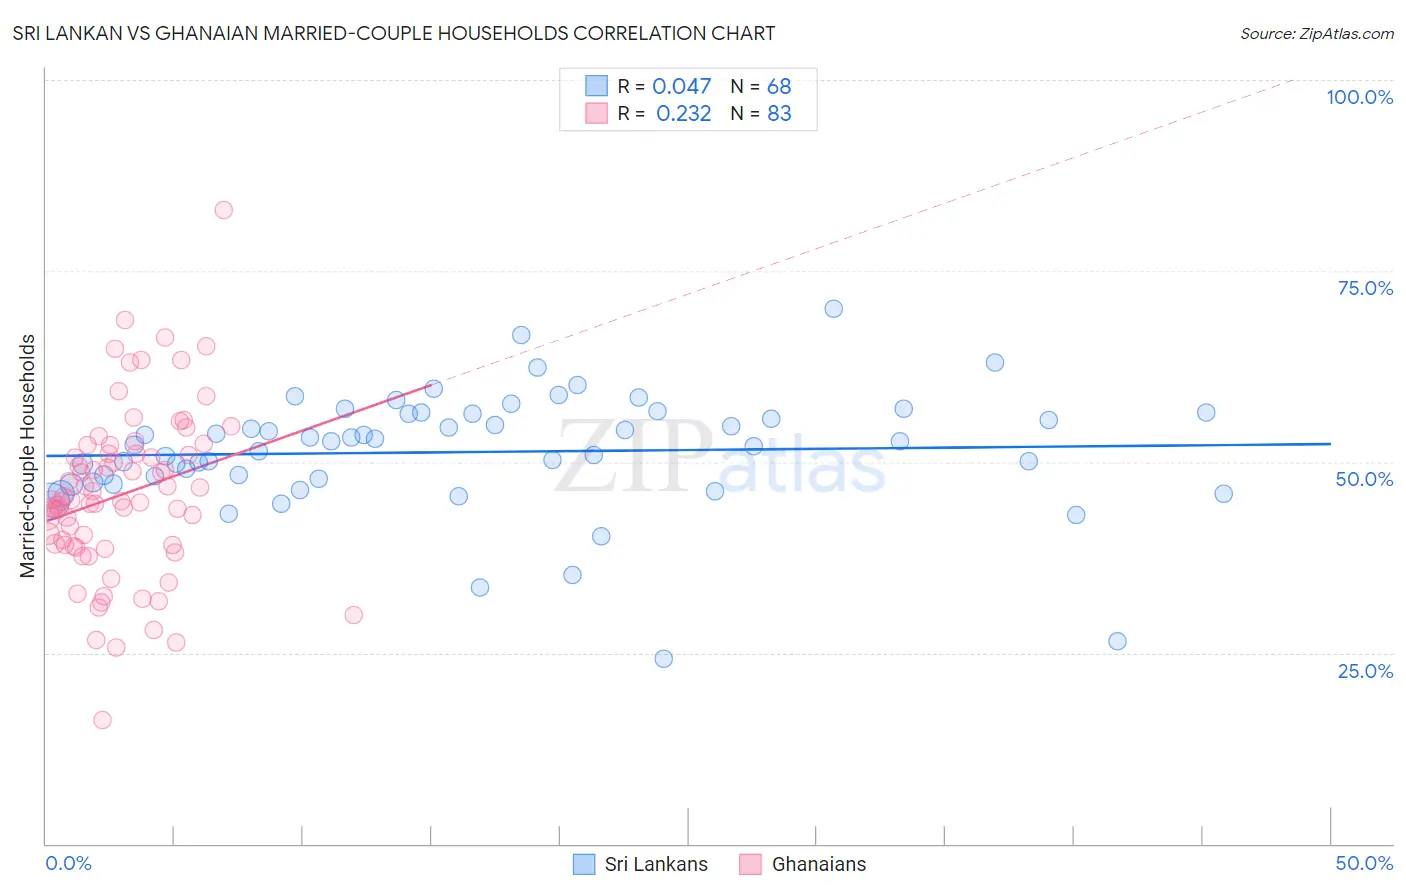
Sri Lankan vs Ghanaian Married-couple Households Correlation Chart
The statistical analysis conducted on geographies consisting of 440,079,035 people shows no correlation between the proportion of Sri Lankans and percentage of married-couple family households in the United States with a correlation coefficient (R) of 0.047 and weighted average of 49.0%. Similarly, the statistical analysis conducted on geographies consisting of 190,506,796 people shows a weak positive correlation between the proportion of Ghanaians and percentage of married-couple family households in the United States with a correlation coefficient (R) of 0.232 and weighted average of 42.2%, a difference of 15.9%.
Married-couple Households Correlation Summary
| Measurement | Sri Lankan | Ghanaian |
| Minimum | 24.2% | 16.2% |
| Maximum | 70.0% | 82.9% |
| Range | 45.7% | 66.7% |
| Mean | 51.3% | 45.7% |
| Median | 52.4% | 44.9% |
| Interquartile 25% (IQ1) | 47.6% | 39.1% |
| Interquartile 75% (IQ3) | 56.4% | 51.1% |
| Interquartile Range (IQR) | 8.8% | 12.0% |
| Standard Deviation (Sample) | 7.8% | 11.0% |
| Standard Deviation (Population) | 7.7% | 10.9% |
Similar Demographics by Married-couple Households
Demographics Similar to Sri Lankans by Married-couple Households
In terms of married-couple households, the demographic groups most similar to Sri Lankans are Iranian (49.0%, a difference of 0.0%), Scottish (49.0%, a difference of 0.090%), Greek (48.9%, a difference of 0.090%), Italian (49.0%, a difference of 0.11%), and Lithuanian (48.9%, a difference of 0.18%).
| Demographics | Rating | Rank | Married-couple Households |
| Bolivians | 99.8 /100 | #30 | Exceptional 49.2% |
| Native Hawaiians | 99.8 /100 | #31 | Exceptional 49.1% |
| Hungarians | 99.8 /100 | #32 | Exceptional 49.1% |
| Immigrants | Asia | 99.7 /100 | #33 | Exceptional 49.1% |
| Italians | 99.7 /100 | #34 | Exceptional 49.0% |
| Scottish | 99.7 /100 | #35 | Exceptional 49.0% |
| Iranians | 99.7 /100 | #36 | Exceptional 49.0% |
| Sri Lankans | 99.7 /100 | #37 | Exceptional 49.0% |
| Greeks | 99.7 /100 | #38 | Exceptional 48.9% |
| Lithuanians | 99.6 /100 | #39 | Exceptional 48.9% |
| Immigrants | Bolivia | 99.6 /100 | #40 | Exceptional 48.9% |
| Immigrants | Lebanon | 99.6 /100 | #41 | Exceptional 48.9% |
| Immigrants | Vietnam | 99.6 /100 | #42 | Exceptional 48.8% |
| Immigrants | Iran | 99.6 /100 | #43 | Exceptional 48.8% |
| Welsh | 99.5 /100 | #44 | Exceptional 48.8% |
Demographics Similar to Ghanaians by Married-couple Households
In terms of married-couple households, the demographic groups most similar to Ghanaians are Belizean (42.2%, a difference of 0.010%), Cheyenne (42.3%, a difference of 0.030%), Chippewa (42.1%, a difference of 0.25%), Immigrants from Eritrea (42.1%, a difference of 0.33%), and Sudanese (42.1%, a difference of 0.38%).
| Demographics | Rating | Rank | Married-couple Households |
| Immigrants | Africa | 0.0 /100 | #278 | Tragic 42.9% |
| Sierra Leoneans | 0.0 /100 | #279 | Tragic 42.9% |
| Immigrants | Ecuador | 0.0 /100 | #280 | Tragic 42.9% |
| Immigrants | Guatemala | 0.0 /100 | #281 | Tragic 42.8% |
| Bermudans | 0.0 /100 | #282 | Tragic 42.4% |
| Inupiat | 0.0 /100 | #283 | Tragic 42.4% |
| Cheyenne | 0.0 /100 | #284 | Tragic 42.3% |
| Ghanaians | 0.0 /100 | #285 | Tragic 42.2% |
| Belizeans | 0.0 /100 | #286 | Tragic 42.2% |
| Chippewa | 0.0 /100 | #287 | Tragic 42.1% |
| Immigrants | Eritrea | 0.0 /100 | #288 | Tragic 42.1% |
| Sudanese | 0.0 /100 | #289 | Tragic 42.1% |
| Hondurans | 0.0 /100 | #290 | Tragic 42.1% |
| Paiute | 0.0 /100 | #291 | Tragic 42.1% |
| Indonesians | 0.0 /100 | #292 | Tragic 42.0% |