Sri Lankan vs Immigrants from Malaysia Married-couple Households
COMPARE
Sri Lankan
Immigrants from Malaysia
Married-couple Households
Married-couple Households Comparison
Sri Lankans
Immigrants from Malaysia
49.0%
MARRIED-COUPLE HOUSEHOLDS
99.7/ 100
METRIC RATING
37th/ 347
METRIC RANK
47.2%
MARRIED-COUPLE HOUSEHOLDS
85.2/ 100
METRIC RATING
137th/ 347
METRIC RANK
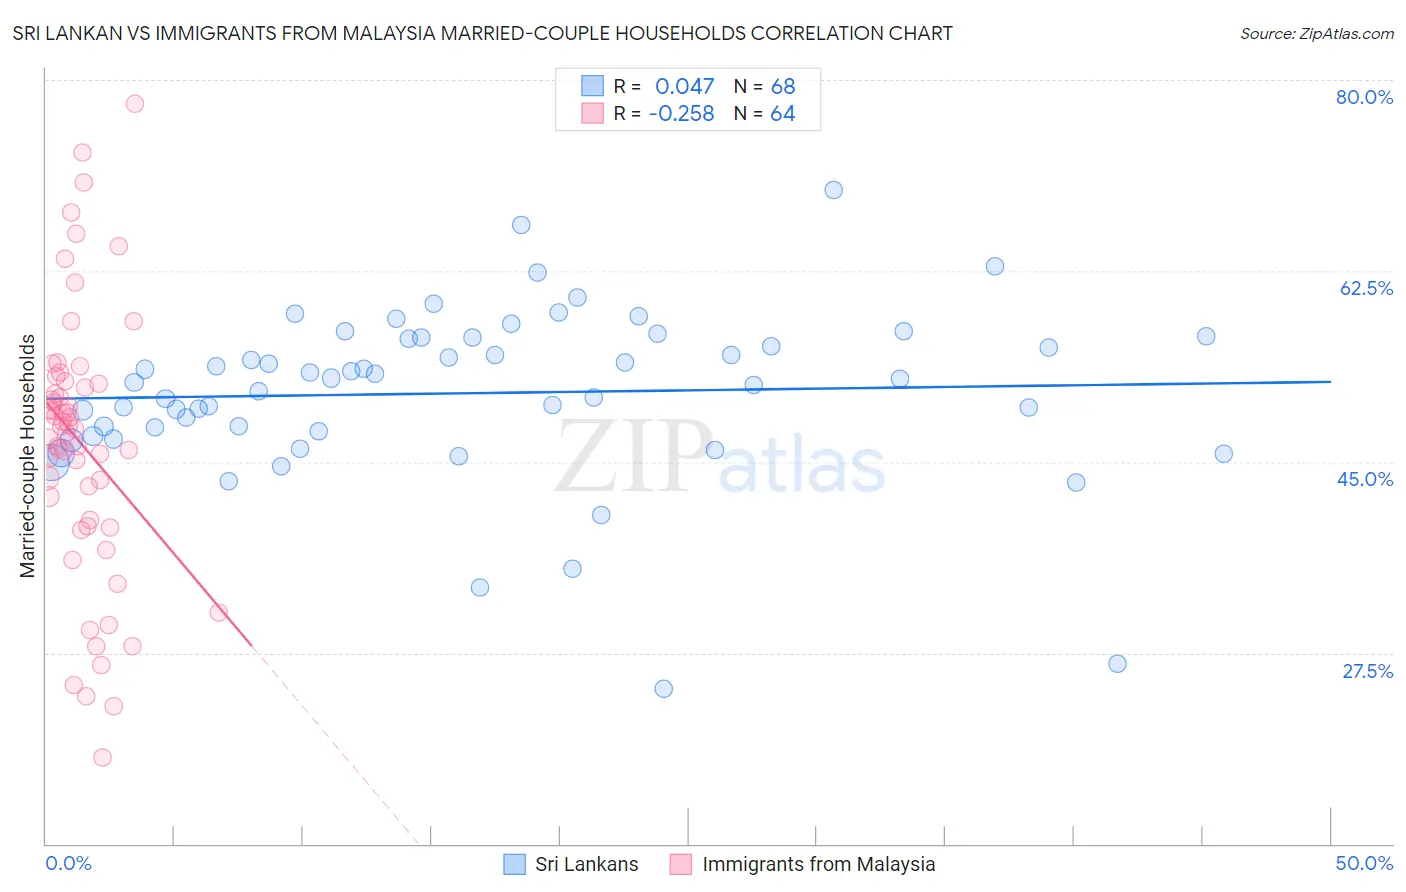
Sri Lankan vs Immigrants from Malaysia Married-couple Households Correlation Chart
The statistical analysis conducted on geographies consisting of 440,079,035 people shows no correlation between the proportion of Sri Lankans and percentage of married-couple family households in the United States with a correlation coefficient (R) of 0.047 and weighted average of 49.0%. Similarly, the statistical analysis conducted on geographies consisting of 197,920,674 people shows a weak negative correlation between the proportion of Immigrants from Malaysia and percentage of married-couple family households in the United States with a correlation coefficient (R) of -0.258 and weighted average of 47.2%, a difference of 3.7%.
Married-couple Households Correlation Summary
| Measurement | Sri Lankan | Immigrants from Malaysia |
| Minimum | 24.2% | 17.9% |
| Maximum | 70.0% | 77.8% |
| Range | 45.7% | 59.9% |
| Mean | 51.3% | 46.7% |
| Median | 52.4% | 48.2% |
| Interquartile 25% (IQ1) | 47.6% | 39.4% |
| Interquartile 75% (IQ3) | 56.4% | 52.3% |
| Interquartile Range (IQR) | 8.8% | 12.8% |
| Standard Deviation (Sample) | 7.8% | 12.4% |
| Standard Deviation (Population) | 7.7% | 12.3% |
Similar Demographics by Married-couple Households
Demographics Similar to Sri Lankans by Married-couple Households
In terms of married-couple households, the demographic groups most similar to Sri Lankans are Iranian (49.0%, a difference of 0.0%), Scottish (49.0%, a difference of 0.090%), Greek (48.9%, a difference of 0.090%), Italian (49.0%, a difference of 0.11%), and Lithuanian (48.9%, a difference of 0.18%).
| Demographics | Rating | Rank | Married-couple Households |
| Bolivians | 99.8 /100 | #30 | Exceptional 49.2% |
| Native Hawaiians | 99.8 /100 | #31 | Exceptional 49.1% |
| Hungarians | 99.8 /100 | #32 | Exceptional 49.1% |
| Immigrants | Asia | 99.7 /100 | #33 | Exceptional 49.1% |
| Italians | 99.7 /100 | #34 | Exceptional 49.0% |
| Scottish | 99.7 /100 | #35 | Exceptional 49.0% |
| Iranians | 99.7 /100 | #36 | Exceptional 49.0% |
| Sri Lankans | 99.7 /100 | #37 | Exceptional 49.0% |
| Greeks | 99.7 /100 | #38 | Exceptional 48.9% |
| Lithuanians | 99.6 /100 | #39 | Exceptional 48.9% |
| Immigrants | Bolivia | 99.6 /100 | #40 | Exceptional 48.9% |
| Immigrants | Lebanon | 99.6 /100 | #41 | Exceptional 48.9% |
| Immigrants | Vietnam | 99.6 /100 | #42 | Exceptional 48.8% |
| Immigrants | Iran | 99.6 /100 | #43 | Exceptional 48.8% |
| Welsh | 99.5 /100 | #44 | Exceptional 48.8% |
Demographics Similar to Immigrants from Malaysia by Married-couple Households
In terms of married-couple households, the demographic groups most similar to Immigrants from Malaysia are New Zealander (47.2%, a difference of 0.0%), Immigrants from Afghanistan (47.2%, a difference of 0.010%), Immigrants from Sweden (47.2%, a difference of 0.040%), Immigrants from Greece (47.2%, a difference of 0.060%), and Immigrants from Argentina (47.2%, a difference of 0.060%).
| Demographics | Rating | Rank | Married-couple Households |
| Immigrants | Hungary | 87.8 /100 | #130 | Excellent 47.3% |
| Immigrants | Denmark | 87.5 /100 | #131 | Excellent 47.3% |
| Immigrants | Ukraine | 86.7 /100 | #132 | Excellent 47.3% |
| South Africans | 86.4 /100 | #133 | Excellent 47.3% |
| Immigrants | Greece | 86.0 /100 | #134 | Excellent 47.2% |
| Immigrants | Argentina | 86.0 /100 | #135 | Excellent 47.2% |
| New Zealanders | 85.3 /100 | #136 | Excellent 47.2% |
| Immigrants | Malaysia | 85.2 /100 | #137 | Excellent 47.2% |
| Immigrants | Afghanistan | 85.1 /100 | #138 | Excellent 47.2% |
| Immigrants | Sweden | 84.7 /100 | #139 | Excellent 47.2% |
| Spanish | 84.5 /100 | #140 | Excellent 47.2% |
| Costa Ricans | 84.4 /100 | #141 | Excellent 47.2% |
| Spaniards | 84.1 /100 | #142 | Excellent 47.2% |
| Immigrants | Belarus | 83.8 /100 | #143 | Excellent 47.2% |
| Mexicans | 83.4 /100 | #144 | Excellent 47.1% |