Hopi vs Chinese Married-couple Households
COMPARE
Hopi
Chinese
Married-couple Households
Married-couple Households Comparison
Hopi
Chinese
36.7%
MARRIED-COUPLE HOUSEHOLDS
0.0/ 100
METRIC RATING
345th/ 347
METRIC RANK
50.4%
MARRIED-COUPLE HOUSEHOLDS
100.0/ 100
METRIC RATING
10th/ 347
METRIC RANK
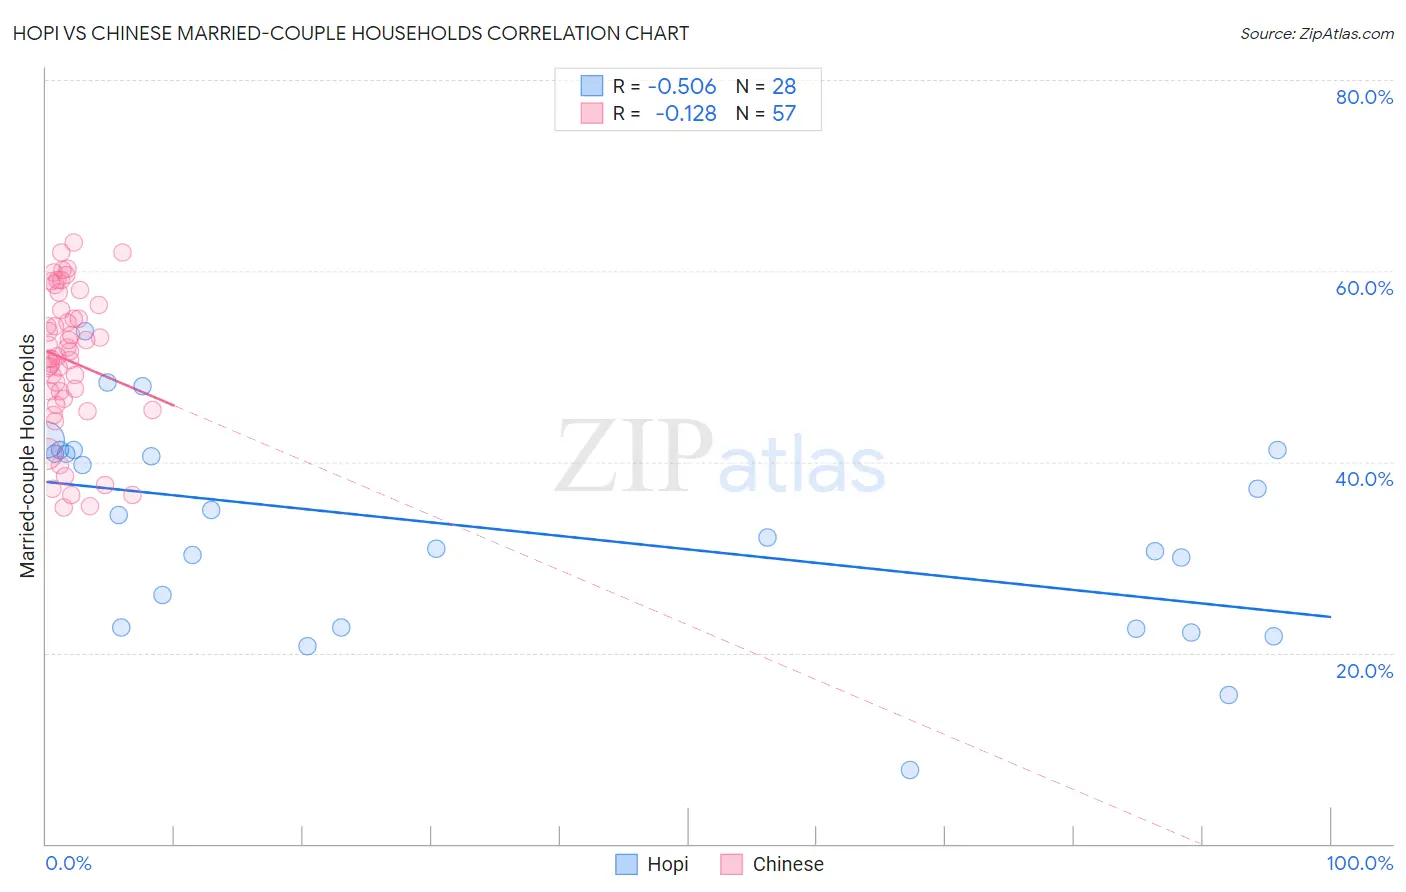
Hopi vs Chinese Married-couple Households Correlation Chart
The statistical analysis conducted on geographies consisting of 74,731,609 people shows a substantial negative correlation between the proportion of Hopi and percentage of married-couple family households in the United States with a correlation coefficient (R) of -0.506 and weighted average of 36.7%. Similarly, the statistical analysis conducted on geographies consisting of 64,801,742 people shows a poor negative correlation between the proportion of Chinese and percentage of married-couple family households in the United States with a correlation coefficient (R) of -0.128 and weighted average of 50.4%, a difference of 37.3%.
Married-couple Households Correlation Summary
| Measurement | Hopi | Chinese |
| Minimum | 7.8% | 35.3% |
| Maximum | 53.7% | 63.0% |
| Range | 45.9% | 27.8% |
| Mean | 32.9% | 50.6% |
| Median | 33.2% | 51.0% |
| Interquartile 25% (IQ1) | 22.6% | 46.3% |
| Interquartile 75% (IQ3) | 41.0% | 56.2% |
| Interquartile Range (IQR) | 18.4% | 9.9% |
| Standard Deviation (Sample) | 10.8% | 7.4% |
| Standard Deviation (Population) | 10.6% | 7.4% |
Similar Demographics by Married-couple Households
Demographics Similar to Hopi by Married-couple Households
In terms of married-couple households, the demographic groups most similar to Hopi are Immigrants from Cabo Verde (36.2%, a difference of 1.2%), Immigrants from Dominican Republic (37.3%, a difference of 1.8%), Immigrants from Grenada (37.5%, a difference of 2.2%), Pima (35.6%, a difference of 3.2%), and Tohono O'odham (37.9%, a difference of 3.3%).
| Demographics | Rating | Rank | Married-couple Households |
| Immigrants | West Indies | 0.0 /100 | #333 | Tragic 39.0% |
| Immigrants | St. Vincent and the Grenadines | 0.0 /100 | #334 | Tragic 38.7% |
| Senegalese | 0.0 /100 | #335 | Tragic 38.6% |
| Blacks/African Americans | 0.0 /100 | #336 | Tragic 38.5% |
| Immigrants | Somalia | 0.0 /100 | #337 | Tragic 38.4% |
| Immigrants | Senegal | 0.0 /100 | #338 | Tragic 38.4% |
| British West Indians | 0.0 /100 | #339 | Tragic 38.3% |
| Dominicans | 0.0 /100 | #340 | Tragic 38.2% |
| Cape Verdeans | 0.0 /100 | #341 | Tragic 38.1% |
| Tohono O'odham | 0.0 /100 | #342 | Tragic 37.9% |
| Immigrants | Grenada | 0.0 /100 | #343 | Tragic 37.5% |
| Immigrants | Dominican Republic | 0.0 /100 | #344 | Tragic 37.3% |
| Hopi | 0.0 /100 | #345 | Tragic 36.7% |
| Immigrants | Cabo Verde | 0.0 /100 | #346 | Tragic 36.2% |
| Pima | 0.0 /100 | #347 | Tragic 35.6% |
Demographics Similar to Chinese by Married-couple Households
In terms of married-couple households, the demographic groups most similar to Chinese are Pennsylvania German (50.4%, a difference of 0.0%), Immigrants from Pakistan (50.1%, a difference of 0.44%), Immigrants from South Central Asia (50.6%, a difference of 0.55%), Swiss (49.9%, a difference of 0.81%), and Immigrants from Korea (49.9%, a difference of 0.98%).
| Demographics | Rating | Rank | Married-couple Households |
| Thais | 100.0 /100 | #3 | Exceptional 51.9% |
| Assyrians/Chaldeans/Syriacs | 100.0 /100 | #4 | Exceptional 51.8% |
| Tongans | 100.0 /100 | #5 | Exceptional 51.6% |
| Danes | 100.0 /100 | #6 | Exceptional 51.1% |
| Filipinos | 100.0 /100 | #7 | Exceptional 51.0% |
| Immigrants | South Central Asia | 100.0 /100 | #8 | Exceptional 50.6% |
| Pennsylvania Germans | 100.0 /100 | #9 | Exceptional 50.4% |
| Chinese | 100.0 /100 | #10 | Exceptional 50.4% |
| Immigrants | Pakistan | 100.0 /100 | #11 | Exceptional 50.1% |
| Swiss | 100.0 /100 | #12 | Exceptional 49.9% |
| Immigrants | Korea | 100.0 /100 | #13 | Exceptional 49.9% |
| Burmese | 100.0 /100 | #14 | Exceptional 49.8% |
| Koreans | 99.9 /100 | #15 | Exceptional 49.7% |
| Swedes | 99.9 /100 | #16 | Exceptional 49.7% |
| Immigrants | Hong Kong | 99.9 /100 | #17 | Exceptional 49.6% |