Cherokee vs Chinese Married-couple Households
COMPARE
Cherokee
Chinese
Married-couple Households
Married-couple Households Comparison
Cherokee
Chinese
46.7%
MARRIED-COUPLE HOUSEHOLDS
65.7/ 100
METRIC RATING
166th/ 347
METRIC RANK
50.4%
MARRIED-COUPLE HOUSEHOLDS
100.0/ 100
METRIC RATING
10th/ 347
METRIC RANK
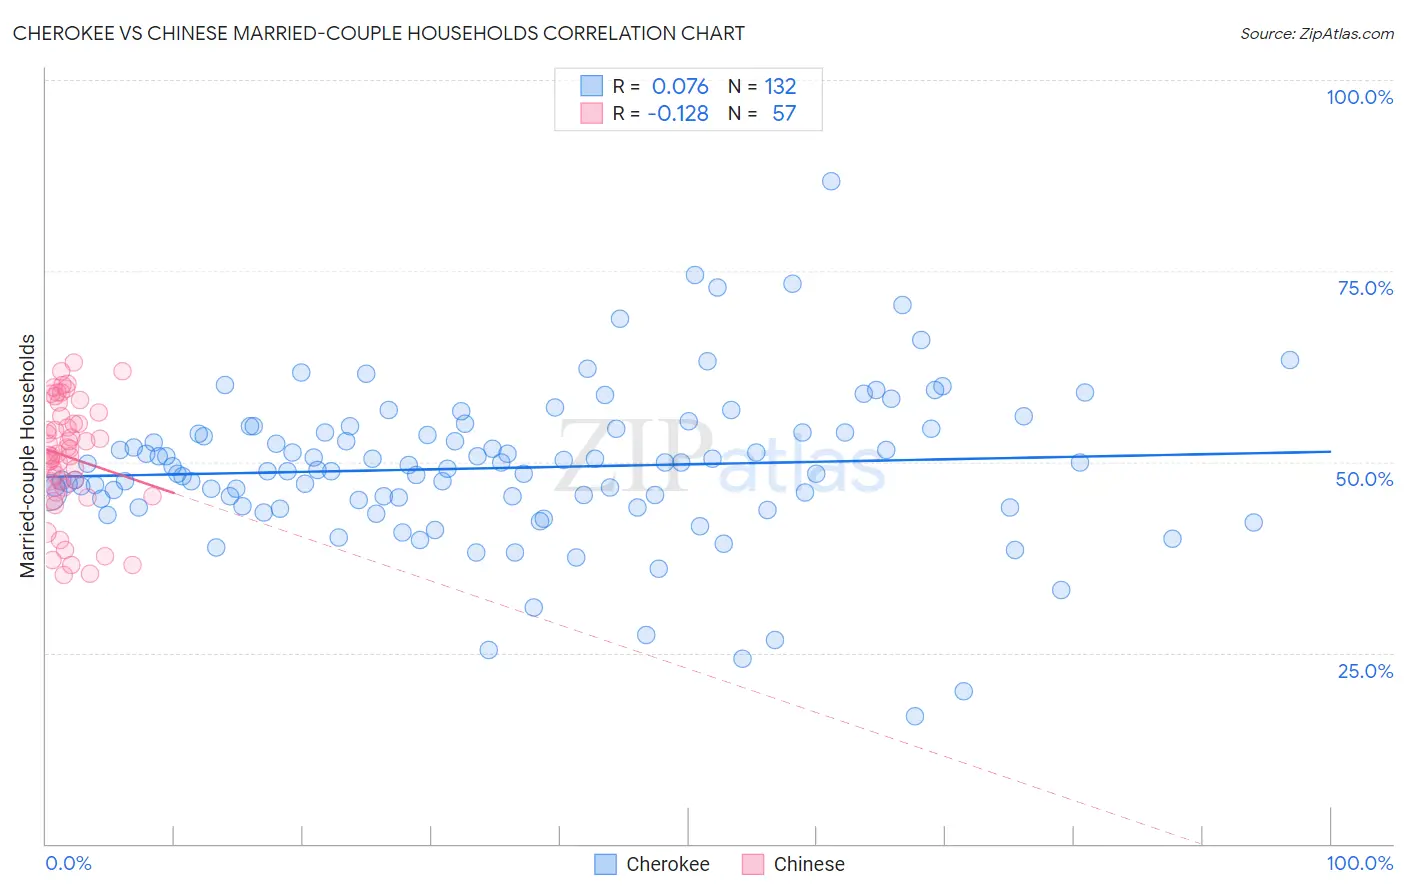
Cherokee vs Chinese Married-couple Households Correlation Chart
The statistical analysis conducted on geographies consisting of 493,370,237 people shows a slight positive correlation between the proportion of Cherokee and percentage of married-couple family households in the United States with a correlation coefficient (R) of 0.076 and weighted average of 46.7%. Similarly, the statistical analysis conducted on geographies consisting of 64,801,742 people shows a poor negative correlation between the proportion of Chinese and percentage of married-couple family households in the United States with a correlation coefficient (R) of -0.128 and weighted average of 50.4%, a difference of 7.8%.
Married-couple Households Correlation Summary
| Measurement | Cherokee | Chinese |
| Minimum | 16.7% | 35.3% |
| Maximum | 86.8% | 63.0% |
| Range | 70.2% | 27.8% |
| Mean | 49.2% | 50.6% |
| Median | 49.0% | 51.0% |
| Interquartile 25% (IQ1) | 44.6% | 46.3% |
| Interquartile 75% (IQ3) | 53.9% | 56.2% |
| Interquartile Range (IQR) | 9.3% | 9.9% |
| Standard Deviation (Sample) | 10.1% | 7.4% |
| Standard Deviation (Population) | 10.1% | 7.4% |
Similar Demographics by Married-couple Households
Demographics Similar to Cherokee by Married-couple Households
In terms of married-couple households, the demographic groups most similar to Cherokee are Immigrants from Croatia (46.7%, a difference of 0.060%), Israeli (46.7%, a difference of 0.14%), Immigrants from Kazakhstan (46.8%, a difference of 0.18%), Immigrants from Southern Europe (46.8%, a difference of 0.18%), and Immigrants from Turkey (46.8%, a difference of 0.19%).
| Demographics | Rating | Rank | Married-couple Households |
| Osage | 73.2 /100 | #159 | Good 46.9% |
| Iraqis | 71.7 /100 | #160 | Good 46.9% |
| Delaware | 71.2 /100 | #161 | Good 46.8% |
| Colombians | 71.0 /100 | #162 | Good 46.8% |
| Immigrants | Turkey | 70.2 /100 | #163 | Good 46.8% |
| Immigrants | Kazakhstan | 70.0 /100 | #164 | Good 46.8% |
| Immigrants | Southern Europe | 69.9 /100 | #165 | Good 46.8% |
| Cherokee | 65.7 /100 | #166 | Good 46.7% |
| Immigrants | Croatia | 64.2 /100 | #167 | Good 46.7% |
| Israelis | 62.3 /100 | #168 | Good 46.7% |
| Spanish American Indians | 59.4 /100 | #169 | Average 46.6% |
| South Americans | 58.0 /100 | #170 | Average 46.6% |
| Immigrants | Chile | 55.7 /100 | #171 | Average 46.5% |
| Immigrants | Australia | 54.6 /100 | #172 | Average 46.5% |
| Immigrants | Norway | 52.0 /100 | #173 | Average 46.5% |
Demographics Similar to Chinese by Married-couple Households
In terms of married-couple households, the demographic groups most similar to Chinese are Pennsylvania German (50.4%, a difference of 0.0%), Immigrants from Pakistan (50.1%, a difference of 0.44%), Immigrants from South Central Asia (50.6%, a difference of 0.55%), Swiss (49.9%, a difference of 0.81%), and Immigrants from Korea (49.9%, a difference of 0.98%).
| Demographics | Rating | Rank | Married-couple Households |
| Thais | 100.0 /100 | #3 | Exceptional 51.9% |
| Assyrians/Chaldeans/Syriacs | 100.0 /100 | #4 | Exceptional 51.8% |
| Tongans | 100.0 /100 | #5 | Exceptional 51.6% |
| Danes | 100.0 /100 | #6 | Exceptional 51.1% |
| Filipinos | 100.0 /100 | #7 | Exceptional 51.0% |
| Immigrants | South Central Asia | 100.0 /100 | #8 | Exceptional 50.6% |
| Pennsylvania Germans | 100.0 /100 | #9 | Exceptional 50.4% |
| Chinese | 100.0 /100 | #10 | Exceptional 50.4% |
| Immigrants | Pakistan | 100.0 /100 | #11 | Exceptional 50.1% |
| Swiss | 100.0 /100 | #12 | Exceptional 49.9% |
| Immigrants | Korea | 100.0 /100 | #13 | Exceptional 49.9% |
| Burmese | 100.0 /100 | #14 | Exceptional 49.8% |
| Koreans | 99.9 /100 | #15 | Exceptional 49.7% |
| Swedes | 99.9 /100 | #16 | Exceptional 49.7% |
| Immigrants | Hong Kong | 99.9 /100 | #17 | Exceptional 49.6% |