Sri Lankan vs Lumbee Married-couple Households
COMPARE
Sri Lankan
Lumbee
Married-couple Households
Married-couple Households Comparison
Sri Lankans
Lumbee
49.0%
MARRIED-COUPLE HOUSEHOLDS
99.7/ 100
METRIC RATING
37th/ 347
METRIC RANK
39.6%
MARRIED-COUPLE HOUSEHOLDS
0.0/ 100
METRIC RATING
327th/ 347
METRIC RANK
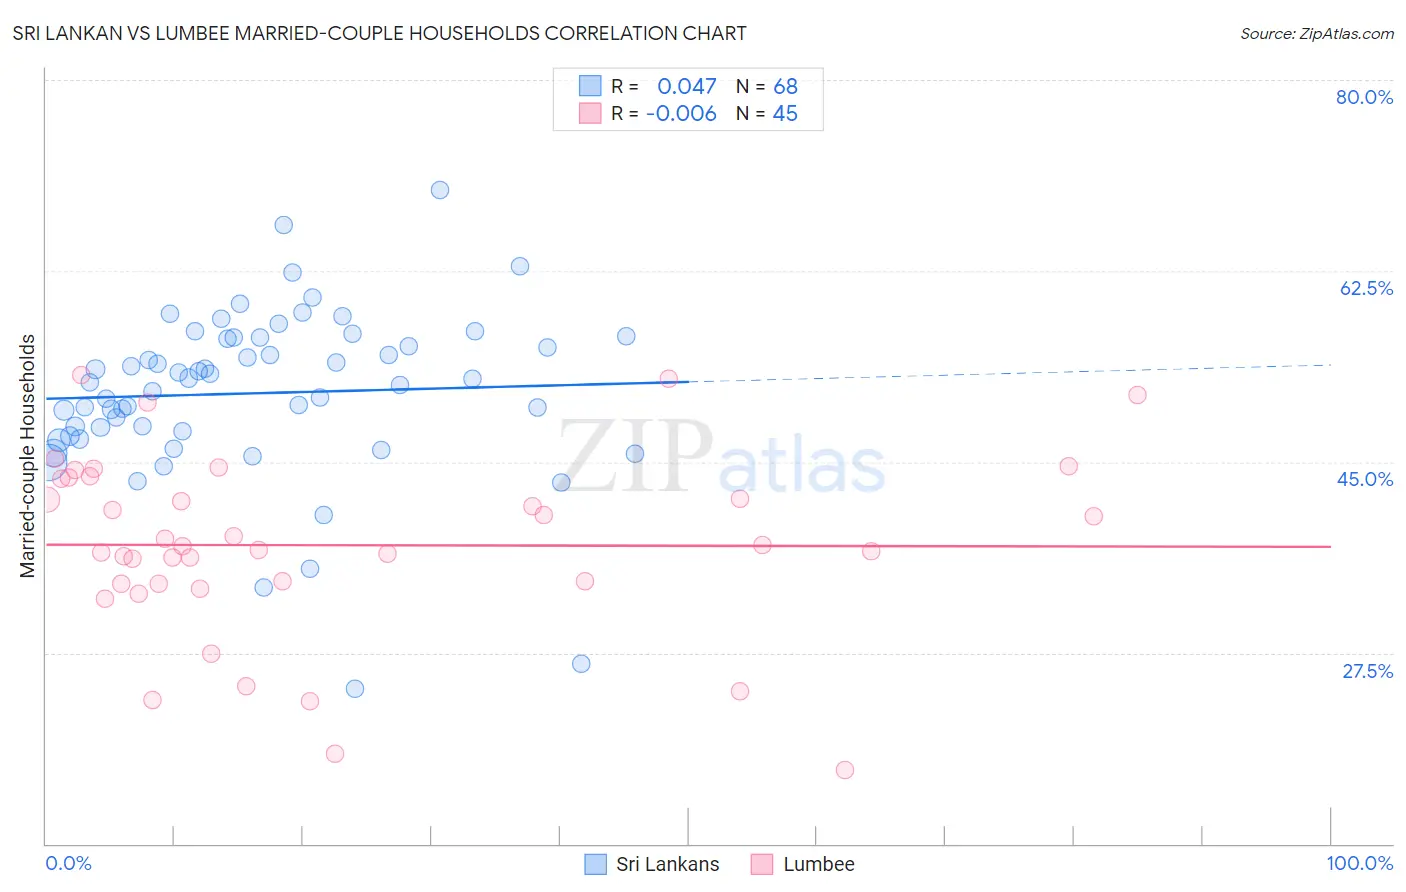
Sri Lankan vs Lumbee Married-couple Households Correlation Chart
The statistical analysis conducted on geographies consisting of 440,079,035 people shows no correlation between the proportion of Sri Lankans and percentage of married-couple family households in the United States with a correlation coefficient (R) of 0.047 and weighted average of 49.0%. Similarly, the statistical analysis conducted on geographies consisting of 92,264,260 people shows no correlation between the proportion of Lumbee and percentage of married-couple family households in the United States with a correlation coefficient (R) of -0.006 and weighted average of 39.6%, a difference of 23.6%.
Married-couple Households Correlation Summary
| Measurement | Sri Lankan | Lumbee |
| Minimum | 24.2% | 16.8% |
| Maximum | 70.0% | 53.0% |
| Range | 45.7% | 36.2% |
| Mean | 51.3% | 37.4% |
| Median | 52.4% | 37.3% |
| Interquartile 25% (IQ1) | 47.6% | 33.9% |
| Interquartile 75% (IQ3) | 56.4% | 43.5% |
| Interquartile Range (IQR) | 8.8% | 9.7% |
| Standard Deviation (Sample) | 7.8% | 8.3% |
| Standard Deviation (Population) | 7.7% | 8.2% |
Similar Demographics by Married-couple Households
Demographics Similar to Sri Lankans by Married-couple Households
In terms of married-couple households, the demographic groups most similar to Sri Lankans are Iranian (49.0%, a difference of 0.0%), Scottish (49.0%, a difference of 0.090%), Greek (48.9%, a difference of 0.090%), Italian (49.0%, a difference of 0.11%), and Lithuanian (48.9%, a difference of 0.18%).
| Demographics | Rating | Rank | Married-couple Households |
| Bolivians | 99.8 /100 | #30 | Exceptional 49.2% |
| Native Hawaiians | 99.8 /100 | #31 | Exceptional 49.1% |
| Hungarians | 99.8 /100 | #32 | Exceptional 49.1% |
| Immigrants | Asia | 99.7 /100 | #33 | Exceptional 49.1% |
| Italians | 99.7 /100 | #34 | Exceptional 49.0% |
| Scottish | 99.7 /100 | #35 | Exceptional 49.0% |
| Iranians | 99.7 /100 | #36 | Exceptional 49.0% |
| Sri Lankans | 99.7 /100 | #37 | Exceptional 49.0% |
| Greeks | 99.7 /100 | #38 | Exceptional 48.9% |
| Lithuanians | 99.6 /100 | #39 | Exceptional 48.9% |
| Immigrants | Bolivia | 99.6 /100 | #40 | Exceptional 48.9% |
| Immigrants | Lebanon | 99.6 /100 | #41 | Exceptional 48.9% |
| Immigrants | Vietnam | 99.6 /100 | #42 | Exceptional 48.8% |
| Immigrants | Iran | 99.6 /100 | #43 | Exceptional 48.8% |
| Welsh | 99.5 /100 | #44 | Exceptional 48.8% |
Demographics Similar to Lumbee by Married-couple Households
In terms of married-couple households, the demographic groups most similar to Lumbee are U.S. Virgin Islander (39.8%, a difference of 0.47%), Barbadian (39.4%, a difference of 0.50%), Immigrants from Dominica (39.4%, a difference of 0.57%), Pueblo (40.0%, a difference of 0.93%), and Immigrants from Barbados (39.2%, a difference of 1.0%).
| Demographics | Rating | Rank | Married-couple Households |
| West Indians | 0.0 /100 | #320 | Tragic 40.3% |
| Immigrants | Liberia | 0.0 /100 | #321 | Tragic 40.3% |
| Immigrants | Zaire | 0.0 /100 | #322 | Tragic 40.1% |
| Puerto Ricans | 0.0 /100 | #323 | Tragic 40.1% |
| Navajo | 0.0 /100 | #324 | Tragic 40.1% |
| Pueblo | 0.0 /100 | #325 | Tragic 40.0% |
| U.S. Virgin Islanders | 0.0 /100 | #326 | Tragic 39.8% |
| Lumbee | 0.0 /100 | #327 | Tragic 39.6% |
| Barbadians | 0.0 /100 | #328 | Tragic 39.4% |
| Immigrants | Dominica | 0.0 /100 | #329 | Tragic 39.4% |
| Immigrants | Barbados | 0.0 /100 | #330 | Tragic 39.2% |
| Immigrants | Congo | 0.0 /100 | #331 | Tragic 39.0% |
| Somalis | 0.0 /100 | #332 | Tragic 39.0% |
| Immigrants | West Indies | 0.0 /100 | #333 | Tragic 39.0% |
| Immigrants | St. Vincent and the Grenadines | 0.0 /100 | #334 | Tragic 38.7% |