Scandinavian vs Subsaharan African Family Households
COMPARE
Scandinavian
Subsaharan African
Family Households
Family Households Comparison
Scandinavians
Sub-Saharan Africans
65.0%
FAMILY HOUSEHOLDS
96.8/ 100
METRIC RATING
110th/ 347
METRIC RANK
62.1%
FAMILY HOUSEHOLDS
0.0/ 100
METRIC RATING
309th/ 347
METRIC RANK
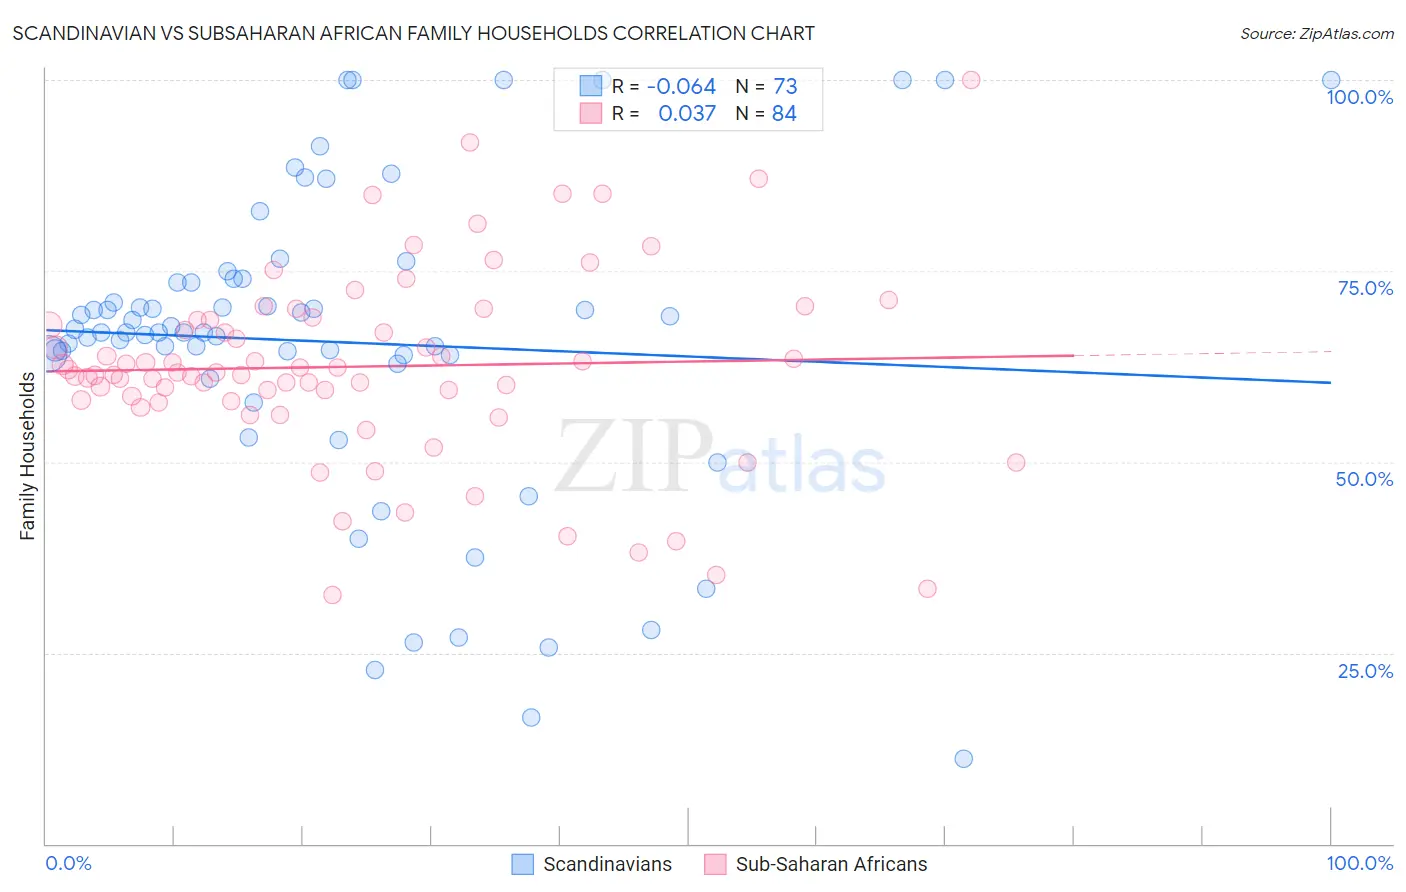
Scandinavian vs Subsaharan African Family Households Correlation Chart
The statistical analysis conducted on geographies consisting of 472,285,900 people shows a slight negative correlation between the proportion of Scandinavians and percentage of family households in the United States with a correlation coefficient (R) of -0.064 and weighted average of 65.0%. Similarly, the statistical analysis conducted on geographies consisting of 507,604,715 people shows no correlation between the proportion of Sub-Saharan Africans and percentage of family households in the United States with a correlation coefficient (R) of 0.037 and weighted average of 62.1%, a difference of 4.8%.
Family Households Correlation Summary
| Measurement | Scandinavian | Subsaharan African |
| Minimum | 11.1% | 32.6% |
| Maximum | 100.0% | 100.0% |
| Range | 88.9% | 67.4% |
| Mean | 65.7% | 62.5% |
| Median | 67.0% | 61.7% |
| Interquartile 25% (IQ1) | 63.4% | 58.0% |
| Interquartile 75% (IQ3) | 73.7% | 68.6% |
| Interquartile Range (IQR) | 10.3% | 10.5% |
| Standard Deviation (Sample) | 20.2% | 12.5% |
| Standard Deviation (Population) | 20.0% | 12.4% |
Similar Demographics by Family Households
Demographics Similar to Scandinavians by Family Households
In terms of family households, the demographic groups most similar to Scandinavians are European (65.0%, a difference of 0.0%), Immigrants from Guatemala (65.0%, a difference of 0.010%), Immigrants from Jordan (65.0%, a difference of 0.040%), Palestinian (65.1%, a difference of 0.050%), and White/Caucasian (65.1%, a difference of 0.060%).
| Demographics | Rating | Rank | Family Households |
| Indians (Asian) | 97.9 /100 | #103 | Exceptional 65.1% |
| Spaniards | 97.8 /100 | #104 | Exceptional 65.1% |
| English | 97.4 /100 | #105 | Exceptional 65.1% |
| Whites/Caucasians | 97.3 /100 | #106 | Exceptional 65.1% |
| Alaska Natives | 97.3 /100 | #107 | Exceptional 65.1% |
| Palestinians | 97.2 /100 | #108 | Exceptional 65.1% |
| Immigrants | Guatemala | 96.9 /100 | #109 | Exceptional 65.0% |
| Scandinavians | 96.8 /100 | #110 | Exceptional 65.0% |
| Europeans | 96.8 /100 | #111 | Exceptional 65.0% |
| Immigrants | Jordan | 96.5 /100 | #112 | Exceptional 65.0% |
| Spanish | 96.2 /100 | #113 | Exceptional 65.0% |
| Argentineans | 95.7 /100 | #114 | Exceptional 65.0% |
| Ecuadorians | 95.4 /100 | #115 | Exceptional 65.0% |
| Immigrants | Iraq | 95.4 /100 | #116 | Exceptional 65.0% |
| Cherokee | 95.3 /100 | #117 | Exceptional 65.0% |
Demographics Similar to Sub-Saharan Africans by Family Households
In terms of family households, the demographic groups most similar to Sub-Saharan Africans are Immigrants from Liberia (62.0%, a difference of 0.040%), Immigrants from Norway (62.1%, a difference of 0.050%), Chippewa (62.1%, a difference of 0.050%), Immigrants from Morocco (62.0%, a difference of 0.070%), and Immigrants from Latvia (62.0%, a difference of 0.12%).
| Demographics | Rating | Rank | Family Households |
| Immigrants | Kenya | 0.0 /100 | #302 | Tragic 62.3% |
| Cree | 0.0 /100 | #303 | Tragic 62.3% |
| Iroquois | 0.0 /100 | #304 | Tragic 62.2% |
| Bermudans | 0.0 /100 | #305 | Tragic 62.2% |
| Africans | 0.0 /100 | #306 | Tragic 62.1% |
| Immigrants | Norway | 0.0 /100 | #307 | Tragic 62.1% |
| Chippewa | 0.0 /100 | #308 | Tragic 62.1% |
| Sub-Saharan Africans | 0.0 /100 | #309 | Tragic 62.1% |
| Immigrants | Liberia | 0.0 /100 | #310 | Tragic 62.0% |
| Immigrants | Morocco | 0.0 /100 | #311 | Tragic 62.0% |
| Immigrants | Latvia | 0.0 /100 | #312 | Tragic 62.0% |
| Liberians | 0.0 /100 | #313 | Tragic 62.0% |
| Immigrants | Cabo Verde | 0.0 /100 | #314 | Tragic 61.9% |
| Moroccans | 0.0 /100 | #315 | Tragic 61.9% |
| Immigrants | Middle Africa | 0.0 /100 | #316 | Tragic 61.9% |