Immigrants from Zaire vs Subsaharan African Family Households
COMPARE
Immigrants from Zaire
Subsaharan African
Family Households
Family Households Comparison
Immigrants from Zaire
Sub-Saharan Africans
59.2%
FAMILY HOUSEHOLDS
0.0/ 100
METRIC RATING
345th/ 347
METRIC RANK
62.1%
FAMILY HOUSEHOLDS
0.0/ 100
METRIC RATING
309th/ 347
METRIC RANK
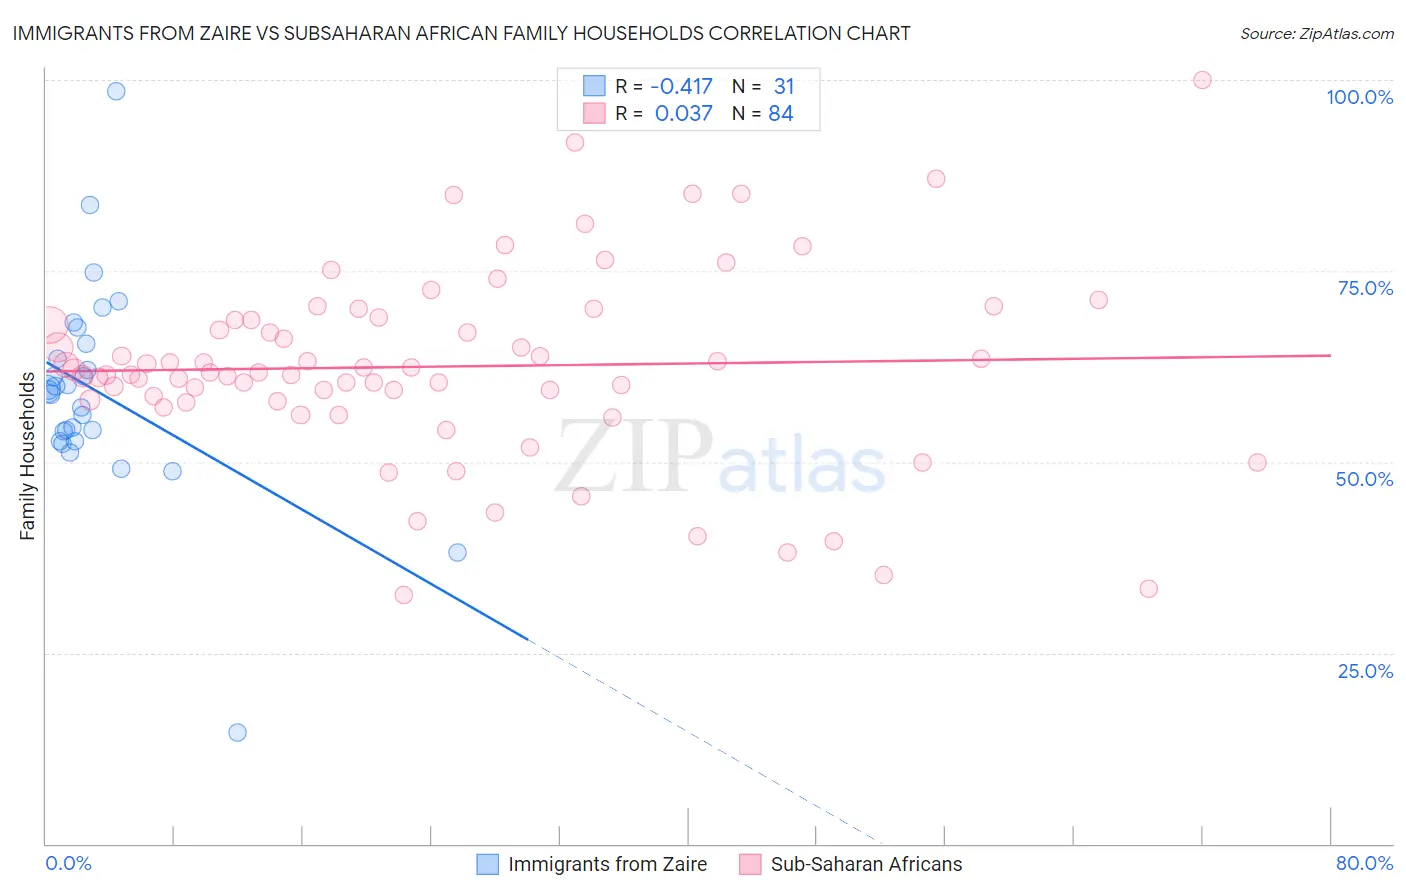
Immigrants from Zaire vs Subsaharan African Family Households Correlation Chart
The statistical analysis conducted on geographies consisting of 107,246,225 people shows a moderate negative correlation between the proportion of Immigrants from Zaire and percentage of family households in the United States with a correlation coefficient (R) of -0.417 and weighted average of 59.2%. Similarly, the statistical analysis conducted on geographies consisting of 507,604,715 people shows no correlation between the proportion of Sub-Saharan Africans and percentage of family households in the United States with a correlation coefficient (R) of 0.037 and weighted average of 62.1%, a difference of 4.9%.
Family Households Correlation Summary
| Measurement | Immigrants from Zaire | Subsaharan African |
| Minimum | 14.5% | 32.6% |
| Maximum | 98.6% | 100.0% |
| Range | 84.1% | 67.4% |
| Mean | 59.2% | 62.5% |
| Median | 59.4% | 61.7% |
| Interquartile 25% (IQ1) | 52.7% | 58.0% |
| Interquartile 75% (IQ3) | 65.5% | 68.6% |
| Interquartile Range (IQR) | 12.8% | 10.5% |
| Standard Deviation (Sample) | 14.0% | 12.5% |
| Standard Deviation (Population) | 13.7% | 12.4% |
Similar Demographics by Family Households
Demographics Similar to Immigrants from Zaire by Family Households
In terms of family households, the demographic groups most similar to Immigrants from Zaire are Immigrants from Congo (59.2%, a difference of 0.14%), Senegalese (59.8%, a difference of 1.1%), Sudanese (60.0%, a difference of 1.4%), Immigrants from Senegal (60.1%, a difference of 1.6%), and Immigrants from Sudan (60.2%, a difference of 1.7%).
| Demographics | Rating | Rank | Family Households |
| Immigrants | Ethiopia | 0.0 /100 | #333 | Tragic 61.2% |
| Immigrants | Eastern Africa | 0.0 /100 | #334 | Tragic 61.1% |
| Carpatho Rusyns | 0.0 /100 | #335 | Tragic 61.1% |
| German Russians | 0.0 /100 | #336 | Tragic 60.9% |
| Soviet Union | 0.0 /100 | #337 | Tragic 60.9% |
| Immigrants | Eritrea | 0.0 /100 | #338 | Tragic 60.8% |
| Immigrants | Saudi Arabia | 0.0 /100 | #339 | Tragic 60.7% |
| Immigrants | Sudan | 0.0 /100 | #340 | Tragic 60.2% |
| Immigrants | Senegal | 0.0 /100 | #341 | Tragic 60.1% |
| Sudanese | 0.0 /100 | #342 | Tragic 60.0% |
| Senegalese | 0.0 /100 | #343 | Tragic 59.8% |
| Immigrants | Congo | 0.0 /100 | #344 | Tragic 59.2% |
| Immigrants | Zaire | 0.0 /100 | #345 | Tragic 59.2% |
| Somalis | 0.0 /100 | #346 | Tragic 57.6% |
| Immigrants | Somalia | 0.0 /100 | #347 | Tragic 56.7% |
Demographics Similar to Sub-Saharan Africans by Family Households
In terms of family households, the demographic groups most similar to Sub-Saharan Africans are Immigrants from Liberia (62.0%, a difference of 0.040%), Immigrants from Norway (62.1%, a difference of 0.050%), Chippewa (62.1%, a difference of 0.050%), Immigrants from Morocco (62.0%, a difference of 0.070%), and Immigrants from Latvia (62.0%, a difference of 0.12%).
| Demographics | Rating | Rank | Family Households |
| Immigrants | Kenya | 0.0 /100 | #302 | Tragic 62.3% |
| Cree | 0.0 /100 | #303 | Tragic 62.3% |
| Iroquois | 0.0 /100 | #304 | Tragic 62.2% |
| Bermudans | 0.0 /100 | #305 | Tragic 62.2% |
| Africans | 0.0 /100 | #306 | Tragic 62.1% |
| Immigrants | Norway | 0.0 /100 | #307 | Tragic 62.1% |
| Chippewa | 0.0 /100 | #308 | Tragic 62.1% |
| Sub-Saharan Africans | 0.0 /100 | #309 | Tragic 62.1% |
| Immigrants | Liberia | 0.0 /100 | #310 | Tragic 62.0% |
| Immigrants | Morocco | 0.0 /100 | #311 | Tragic 62.0% |
| Immigrants | Latvia | 0.0 /100 | #312 | Tragic 62.0% |
| Liberians | 0.0 /100 | #313 | Tragic 62.0% |
| Immigrants | Cabo Verde | 0.0 /100 | #314 | Tragic 61.9% |
| Moroccans | 0.0 /100 | #315 | Tragic 61.9% |
| Immigrants | Middle Africa | 0.0 /100 | #316 | Tragic 61.9% |