Scandinavian vs Immigrants from Caribbean Family Households
COMPARE
Scandinavian
Immigrants from Caribbean
Family Households
Family Households Comparison
Scandinavians
Immigrants from Caribbean
65.0%
FAMILY HOUSEHOLDS
96.8/ 100
METRIC RATING
110th/ 347
METRIC RANK
65.3%
FAMILY HOUSEHOLDS
99.1/ 100
METRIC RATING
89th/ 347
METRIC RANK
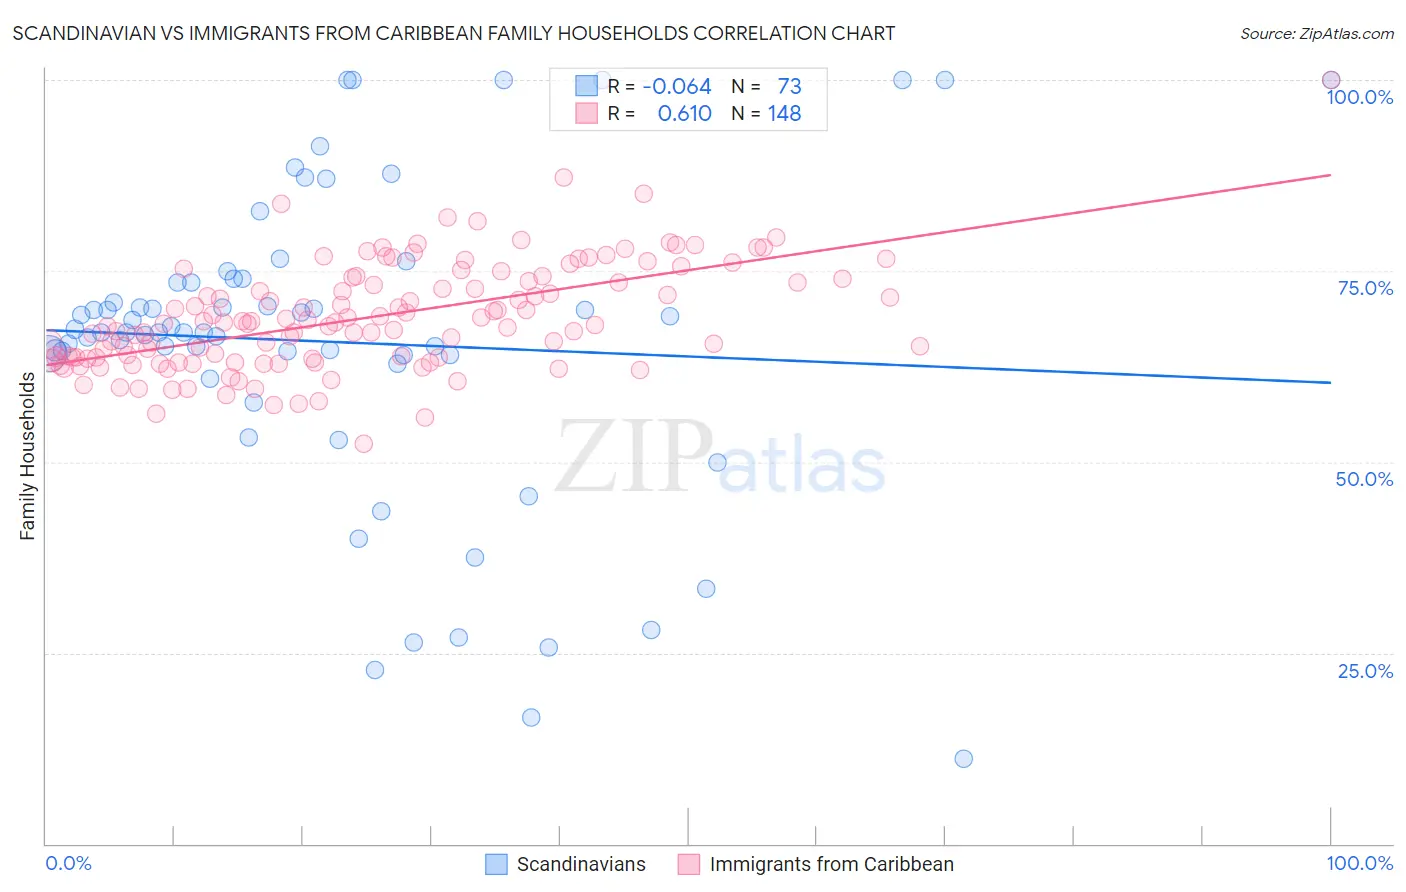
Scandinavian vs Immigrants from Caribbean Family Households Correlation Chart
The statistical analysis conducted on geographies consisting of 472,285,900 people shows a slight negative correlation between the proportion of Scandinavians and percentage of family households in the United States with a correlation coefficient (R) of -0.064 and weighted average of 65.0%. Similarly, the statistical analysis conducted on geographies consisting of 449,694,372 people shows a significant positive correlation between the proportion of Immigrants from Caribbean and percentage of family households in the United States with a correlation coefficient (R) of 0.610 and weighted average of 65.3%, a difference of 0.43%.
Family Households Correlation Summary
| Measurement | Scandinavian | Immigrants from Caribbean |
| Minimum | 11.1% | 52.4% |
| Maximum | 100.0% | 100.0% |
| Range | 88.9% | 47.6% |
| Mean | 65.7% | 68.9% |
| Median | 67.0% | 68.2% |
| Interquartile 25% (IQ1) | 63.4% | 63.6% |
| Interquartile 75% (IQ3) | 73.7% | 73.8% |
| Interquartile Range (IQR) | 10.3% | 10.2% |
| Standard Deviation (Sample) | 20.2% | 7.1% |
| Standard Deviation (Population) | 20.0% | 7.1% |
Similar Demographics by Family Households
Demographics Similar to Scandinavians by Family Households
In terms of family households, the demographic groups most similar to Scandinavians are European (65.0%, a difference of 0.0%), Immigrants from Guatemala (65.0%, a difference of 0.010%), Immigrants from Jordan (65.0%, a difference of 0.040%), Palestinian (65.1%, a difference of 0.050%), and White/Caucasian (65.1%, a difference of 0.060%).
| Demographics | Rating | Rank | Family Households |
| Indians (Asian) | 97.9 /100 | #103 | Exceptional 65.1% |
| Spaniards | 97.8 /100 | #104 | Exceptional 65.1% |
| English | 97.4 /100 | #105 | Exceptional 65.1% |
| Whites/Caucasians | 97.3 /100 | #106 | Exceptional 65.1% |
| Alaska Natives | 97.3 /100 | #107 | Exceptional 65.1% |
| Palestinians | 97.2 /100 | #108 | Exceptional 65.1% |
| Immigrants | Guatemala | 96.9 /100 | #109 | Exceptional 65.0% |
| Scandinavians | 96.8 /100 | #110 | Exceptional 65.0% |
| Europeans | 96.8 /100 | #111 | Exceptional 65.0% |
| Immigrants | Jordan | 96.5 /100 | #112 | Exceptional 65.0% |
| Spanish | 96.2 /100 | #113 | Exceptional 65.0% |
| Argentineans | 95.7 /100 | #114 | Exceptional 65.0% |
| Ecuadorians | 95.4 /100 | #115 | Exceptional 65.0% |
| Immigrants | Iraq | 95.4 /100 | #116 | Exceptional 65.0% |
| Cherokee | 95.3 /100 | #117 | Exceptional 65.0% |
Demographics Similar to Immigrants from Caribbean by Family Households
In terms of family households, the demographic groups most similar to Immigrants from Caribbean are Immigrants from Haiti (65.3%, a difference of 0.010%), Immigrants from Laos (65.3%, a difference of 0.010%), Immigrants from Egypt (65.3%, a difference of 0.040%), Crow (65.3%, a difference of 0.060%), and Hopi (65.3%, a difference of 0.10%).
| Demographics | Rating | Rank | Family Households |
| Immigrants | Lebanon | 99.7 /100 | #82 | Exceptional 65.5% |
| Immigrants | Guyana | 99.6 /100 | #83 | Exceptional 65.5% |
| Americans | 99.6 /100 | #84 | Exceptional 65.5% |
| Immigrants | Cambodia | 99.5 /100 | #85 | Exceptional 65.4% |
| Egyptians | 99.4 /100 | #86 | Exceptional 65.4% |
| Immigrants | Egypt | 99.2 /100 | #87 | Exceptional 65.3% |
| Immigrants | Haiti | 99.1 /100 | #88 | Exceptional 65.3% |
| Immigrants | Caribbean | 99.1 /100 | #89 | Exceptional 65.3% |
| Immigrants | Laos | 99.1 /100 | #90 | Exceptional 65.3% |
| Crow | 98.9 /100 | #91 | Exceptional 65.3% |
| Hopi | 98.8 /100 | #92 | Exceptional 65.3% |
| Guyanese | 98.8 /100 | #93 | Exceptional 65.3% |
| Immigrants | Poland | 98.7 /100 | #94 | Exceptional 65.2% |
| Immigrants | Portugal | 98.6 /100 | #95 | Exceptional 65.2% |
| Swiss | 98.6 /100 | #96 | Exceptional 65.2% |