Scandinavian vs Maltese Family Households
COMPARE
Scandinavian
Maltese
Family Households
Family Households Comparison
Scandinavians
Maltese
65.0%
FAMILY HOUSEHOLDS
96.8/ 100
METRIC RATING
110th/ 347
METRIC RANK
64.7%
FAMILY HOUSEHOLDS
87.4/ 100
METRIC RATING
135th/ 347
METRIC RANK
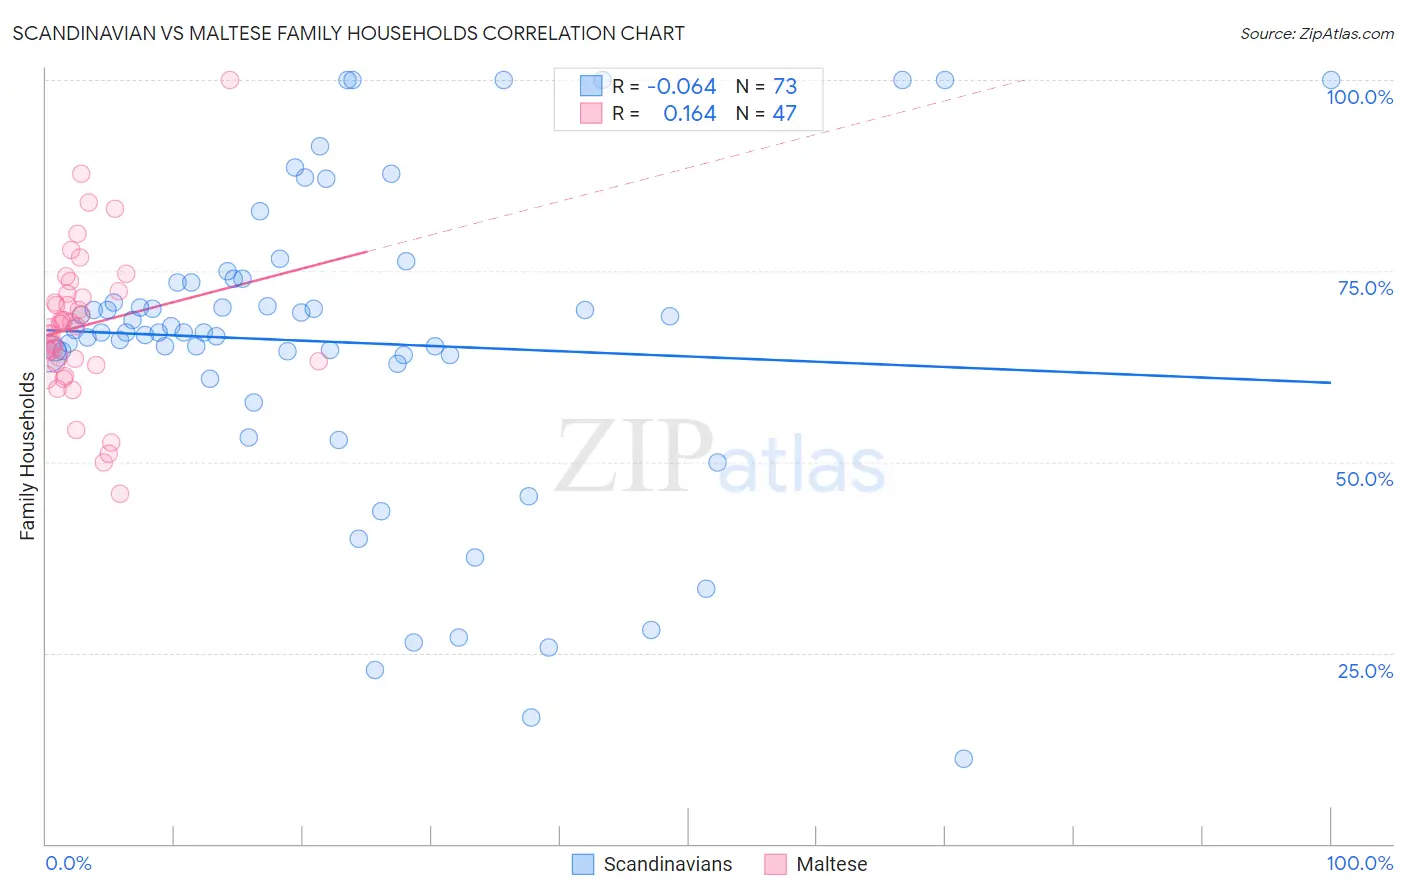
Scandinavian vs Maltese Family Households Correlation Chart
The statistical analysis conducted on geographies consisting of 472,285,900 people shows a slight negative correlation between the proportion of Scandinavians and percentage of family households in the United States with a correlation coefficient (R) of -0.064 and weighted average of 65.0%. Similarly, the statistical analysis conducted on geographies consisting of 126,423,443 people shows a poor positive correlation between the proportion of Maltese and percentage of family households in the United States with a correlation coefficient (R) of 0.164 and weighted average of 64.7%, a difference of 0.49%.
Family Households Correlation Summary
| Measurement | Scandinavian | Maltese |
| Minimum | 11.1% | 45.8% |
| Maximum | 100.0% | 100.0% |
| Range | 88.9% | 54.2% |
| Mean | 65.7% | 67.8% |
| Median | 67.0% | 67.8% |
| Interquartile 25% (IQ1) | 63.4% | 62.9% |
| Interquartile 75% (IQ3) | 73.7% | 72.0% |
| Interquartile Range (IQR) | 10.3% | 9.1% |
| Standard Deviation (Sample) | 20.2% | 9.8% |
| Standard Deviation (Population) | 20.0% | 9.7% |
Similar Demographics by Family Households
Demographics Similar to Scandinavians by Family Households
In terms of family households, the demographic groups most similar to Scandinavians are European (65.0%, a difference of 0.0%), Immigrants from Guatemala (65.0%, a difference of 0.010%), Immigrants from Jordan (65.0%, a difference of 0.040%), Palestinian (65.1%, a difference of 0.050%), and White/Caucasian (65.1%, a difference of 0.060%).
| Demographics | Rating | Rank | Family Households |
| Indians (Asian) | 97.9 /100 | #103 | Exceptional 65.1% |
| Spaniards | 97.8 /100 | #104 | Exceptional 65.1% |
| English | 97.4 /100 | #105 | Exceptional 65.1% |
| Whites/Caucasians | 97.3 /100 | #106 | Exceptional 65.1% |
| Alaska Natives | 97.3 /100 | #107 | Exceptional 65.1% |
| Palestinians | 97.2 /100 | #108 | Exceptional 65.1% |
| Immigrants | Guatemala | 96.9 /100 | #109 | Exceptional 65.0% |
| Scandinavians | 96.8 /100 | #110 | Exceptional 65.0% |
| Europeans | 96.8 /100 | #111 | Exceptional 65.0% |
| Immigrants | Jordan | 96.5 /100 | #112 | Exceptional 65.0% |
| Spanish | 96.2 /100 | #113 | Exceptional 65.0% |
| Argentineans | 95.7 /100 | #114 | Exceptional 65.0% |
| Ecuadorians | 95.4 /100 | #115 | Exceptional 65.0% |
| Immigrants | Iraq | 95.4 /100 | #116 | Exceptional 65.0% |
| Cherokee | 95.3 /100 | #117 | Exceptional 65.0% |
Demographics Similar to Maltese by Family Households
In terms of family households, the demographic groups most similar to Maltese are Greek (64.7%, a difference of 0.020%), Immigrants from China (64.7%, a difference of 0.030%), Immigrants from Scotland (64.7%, a difference of 0.030%), Basque (64.7%, a difference of 0.050%), and Cajun (64.8%, a difference of 0.060%).
| Demographics | Rating | Rank | Family Households |
| Italians | 91.9 /100 | #128 | Exceptional 64.8% |
| Immigrants | Ecuador | 91.4 /100 | #129 | Exceptional 64.8% |
| Immigrants | Italy | 90.2 /100 | #130 | Exceptional 64.8% |
| Immigrants | Nonimmigrants | 90.1 /100 | #131 | Exceptional 64.8% |
| Cajuns | 89.4 /100 | #132 | Excellent 64.8% |
| Belizeans | 89.3 /100 | #133 | Excellent 64.8% |
| Greeks | 88.1 /100 | #134 | Excellent 64.7% |
| Maltese | 87.4 /100 | #135 | Excellent 64.7% |
| Immigrants | China | 86.6 /100 | #136 | Excellent 64.7% |
| Immigrants | Scotland | 86.4 /100 | #137 | Excellent 64.7% |
| Basques | 85.5 /100 | #138 | Excellent 64.7% |
| Immigrants | Jamaica | 85.3 /100 | #139 | Excellent 64.7% |
| Immigrants | North Macedonia | 84.9 /100 | #140 | Excellent 64.7% |
| Immigrants | Cameroon | 84.8 /100 | #141 | Excellent 64.7% |
| Pakistanis | 84.0 /100 | #142 | Excellent 64.7% |