Scandinavian vs Immigrants from Senegal Family Households
COMPARE
Scandinavian
Immigrants from Senegal
Family Households
Family Households Comparison
Scandinavians
Immigrants from Senegal
65.0%
FAMILY HOUSEHOLDS
96.8/ 100
METRIC RATING
110th/ 347
METRIC RANK
60.1%
FAMILY HOUSEHOLDS
0.0/ 100
METRIC RATING
341st/ 347
METRIC RANK
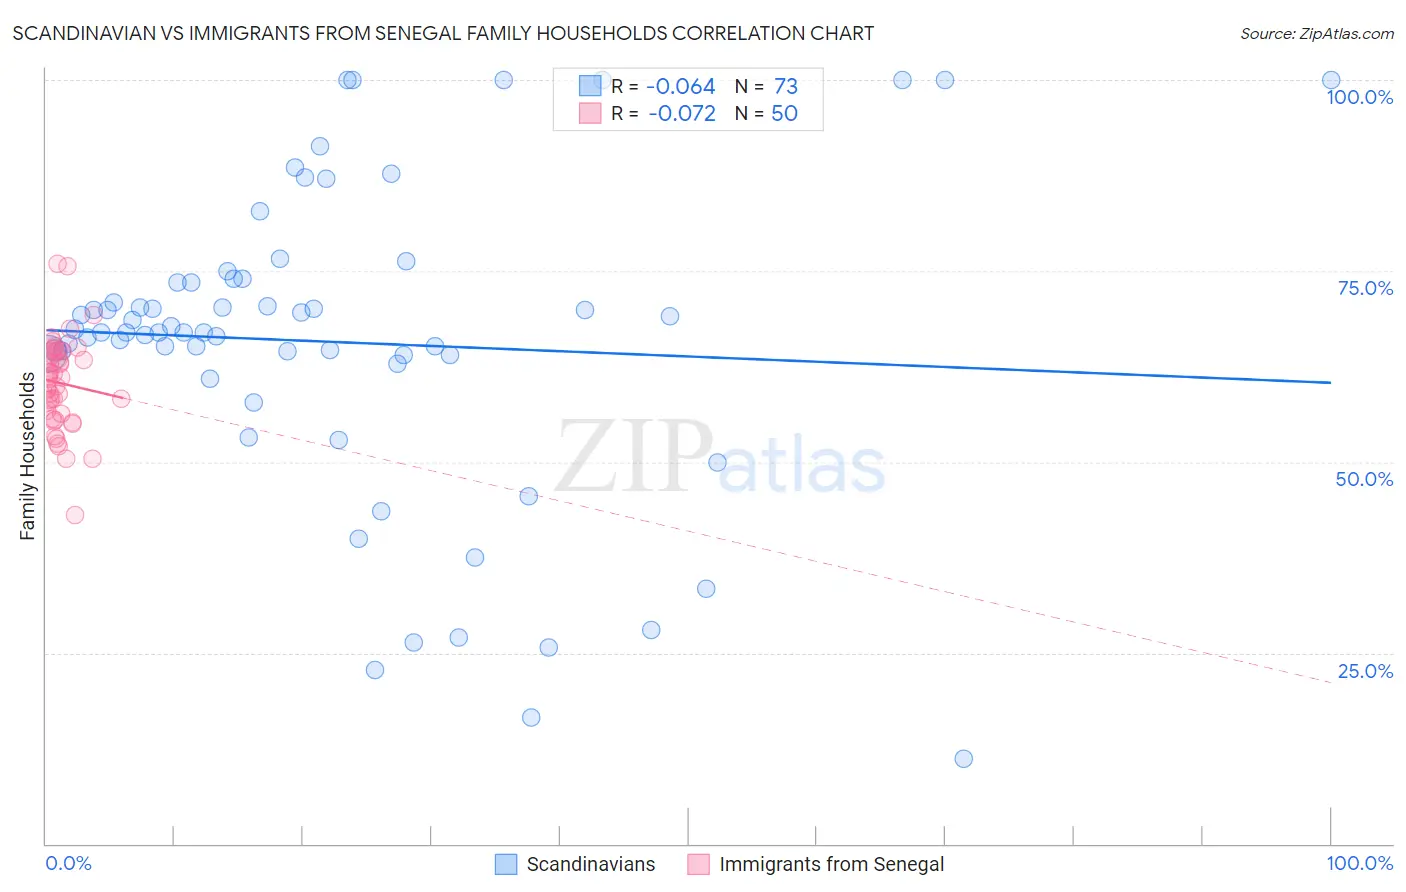
Scandinavian vs Immigrants from Senegal Family Households Correlation Chart
The statistical analysis conducted on geographies consisting of 472,285,900 people shows a slight negative correlation between the proportion of Scandinavians and percentage of family households in the United States with a correlation coefficient (R) of -0.064 and weighted average of 65.0%. Similarly, the statistical analysis conducted on geographies consisting of 90,120,671 people shows a slight negative correlation between the proportion of Immigrants from Senegal and percentage of family households in the United States with a correlation coefficient (R) of -0.072 and weighted average of 60.1%, a difference of 8.2%.
Family Households Correlation Summary
| Measurement | Scandinavian | Immigrants from Senegal |
| Minimum | 11.1% | 43.0% |
| Maximum | 100.0% | 75.9% |
| Range | 88.9% | 32.9% |
| Mean | 65.7% | 60.3% |
| Median | 67.0% | 61.0% |
| Interquartile 25% (IQ1) | 63.4% | 56.2% |
| Interquartile 75% (IQ3) | 73.7% | 64.4% |
| Interquartile Range (IQR) | 10.3% | 8.2% |
| Standard Deviation (Sample) | 20.2% | 6.0% |
| Standard Deviation (Population) | 20.0% | 6.0% |
Similar Demographics by Family Households
Demographics Similar to Scandinavians by Family Households
In terms of family households, the demographic groups most similar to Scandinavians are European (65.0%, a difference of 0.0%), Immigrants from Guatemala (65.0%, a difference of 0.010%), Immigrants from Jordan (65.0%, a difference of 0.040%), Palestinian (65.1%, a difference of 0.050%), and White/Caucasian (65.1%, a difference of 0.060%).
| Demographics | Rating | Rank | Family Households |
| Indians (Asian) | 97.9 /100 | #103 | Exceptional 65.1% |
| Spaniards | 97.8 /100 | #104 | Exceptional 65.1% |
| English | 97.4 /100 | #105 | Exceptional 65.1% |
| Whites/Caucasians | 97.3 /100 | #106 | Exceptional 65.1% |
| Alaska Natives | 97.3 /100 | #107 | Exceptional 65.1% |
| Palestinians | 97.2 /100 | #108 | Exceptional 65.1% |
| Immigrants | Guatemala | 96.9 /100 | #109 | Exceptional 65.0% |
| Scandinavians | 96.8 /100 | #110 | Exceptional 65.0% |
| Europeans | 96.8 /100 | #111 | Exceptional 65.0% |
| Immigrants | Jordan | 96.5 /100 | #112 | Exceptional 65.0% |
| Spanish | 96.2 /100 | #113 | Exceptional 65.0% |
| Argentineans | 95.7 /100 | #114 | Exceptional 65.0% |
| Ecuadorians | 95.4 /100 | #115 | Exceptional 65.0% |
| Immigrants | Iraq | 95.4 /100 | #116 | Exceptional 65.0% |
| Cherokee | 95.3 /100 | #117 | Exceptional 65.0% |
Demographics Similar to Immigrants from Senegal by Family Households
In terms of family households, the demographic groups most similar to Immigrants from Senegal are Immigrants from Sudan (60.2%, a difference of 0.080%), Sudanese (60.0%, a difference of 0.18%), Senegalese (59.8%, a difference of 0.48%), Immigrants from Saudi Arabia (60.7%, a difference of 0.98%), and Immigrants from Eritrea (60.8%, a difference of 1.2%).
| Demographics | Rating | Rank | Family Households |
| Immigrants | Ethiopia | 0.0 /100 | #333 | Tragic 61.2% |
| Immigrants | Eastern Africa | 0.0 /100 | #334 | Tragic 61.1% |
| Carpatho Rusyns | 0.0 /100 | #335 | Tragic 61.1% |
| German Russians | 0.0 /100 | #336 | Tragic 60.9% |
| Soviet Union | 0.0 /100 | #337 | Tragic 60.9% |
| Immigrants | Eritrea | 0.0 /100 | #338 | Tragic 60.8% |
| Immigrants | Saudi Arabia | 0.0 /100 | #339 | Tragic 60.7% |
| Immigrants | Sudan | 0.0 /100 | #340 | Tragic 60.2% |
| Immigrants | Senegal | 0.0 /100 | #341 | Tragic 60.1% |
| Sudanese | 0.0 /100 | #342 | Tragic 60.0% |
| Senegalese | 0.0 /100 | #343 | Tragic 59.8% |
| Immigrants | Congo | 0.0 /100 | #344 | Tragic 59.2% |
| Immigrants | Zaire | 0.0 /100 | #345 | Tragic 59.2% |
| Somalis | 0.0 /100 | #346 | Tragic 57.6% |
| Immigrants | Somalia | 0.0 /100 | #347 | Tragic 56.7% |