Scandinavian vs Immigrants from the Azores Family Households
COMPARE
Scandinavian
Immigrants from the Azores
Family Households
Family Households Comparison
Scandinavians
Immigrants from the Azores
65.0%
FAMILY HOUSEHOLDS
96.8/ 100
METRIC RATING
110th/ 347
METRIC RANK
65.6%
FAMILY HOUSEHOLDS
99.8/ 100
METRIC RATING
76th/ 347
METRIC RANK
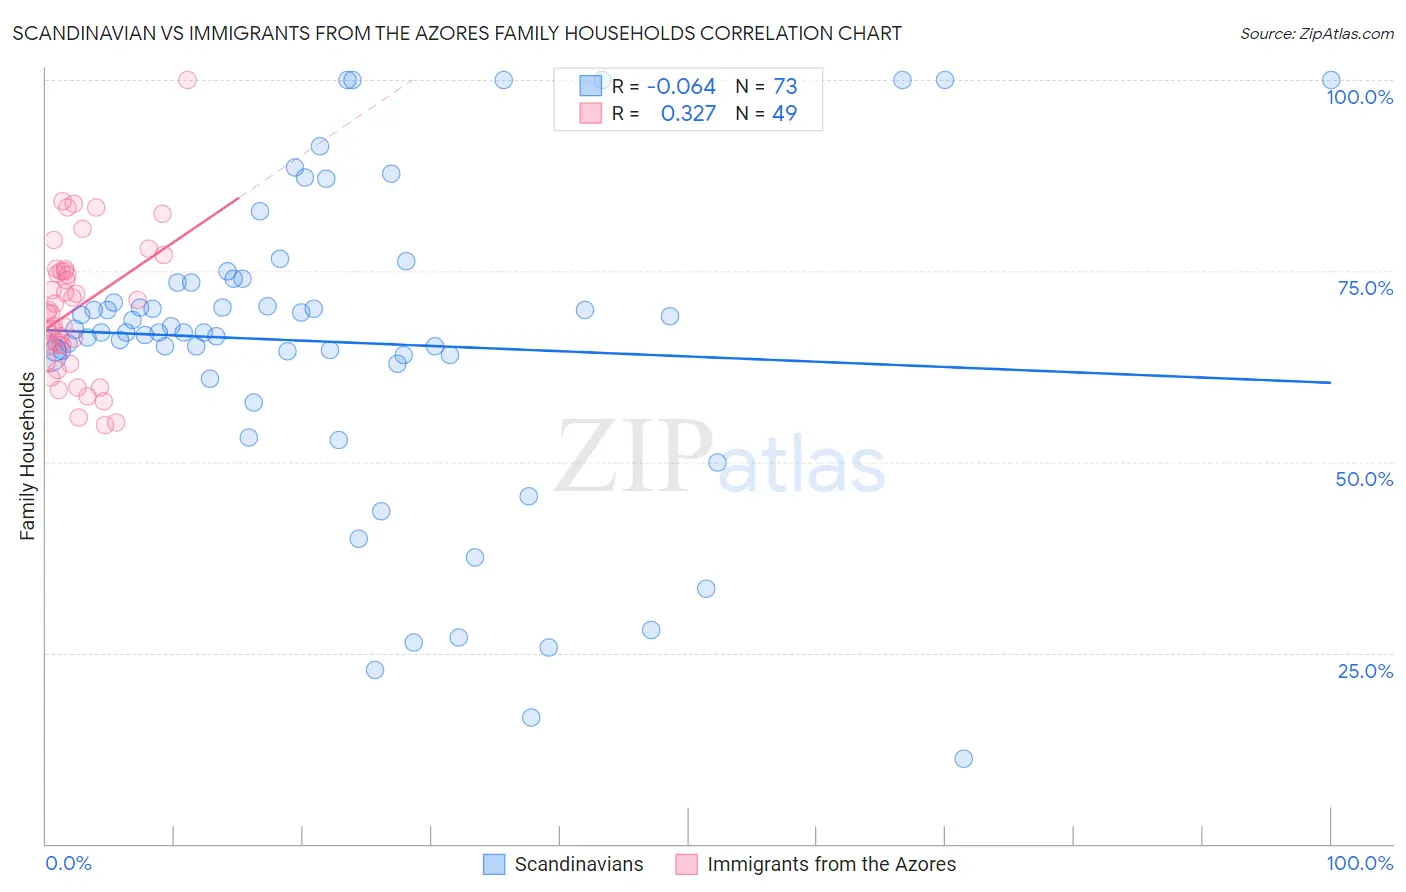
Scandinavian vs Immigrants from the Azores Family Households Correlation Chart
The statistical analysis conducted on geographies consisting of 472,285,900 people shows a slight negative correlation between the proportion of Scandinavians and percentage of family households in the United States with a correlation coefficient (R) of -0.064 and weighted average of 65.0%. Similarly, the statistical analysis conducted on geographies consisting of 46,257,310 people shows a mild positive correlation between the proportion of Immigrants from the Azores and percentage of family households in the United States with a correlation coefficient (R) of 0.327 and weighted average of 65.6%, a difference of 0.92%.
Family Households Correlation Summary
| Measurement | Scandinavian | Immigrants from the Azores |
| Minimum | 11.1% | 54.9% |
| Maximum | 100.0% | 100.0% |
| Range | 88.9% | 45.1% |
| Mean | 65.7% | 70.1% |
| Median | 67.0% | 69.6% |
| Interquartile 25% (IQ1) | 63.4% | 64.1% |
| Interquartile 75% (IQ3) | 73.7% | 75.1% |
| Interquartile Range (IQR) | 10.3% | 11.0% |
| Standard Deviation (Sample) | 20.2% | 9.1% |
| Standard Deviation (Population) | 20.0% | 9.0% |
Similar Demographics by Family Households
Demographics Similar to Scandinavians by Family Households
In terms of family households, the demographic groups most similar to Scandinavians are European (65.0%, a difference of 0.0%), Immigrants from Guatemala (65.0%, a difference of 0.010%), Immigrants from Jordan (65.0%, a difference of 0.040%), Palestinian (65.1%, a difference of 0.050%), and White/Caucasian (65.1%, a difference of 0.060%).
| Demographics | Rating | Rank | Family Households |
| Indians (Asian) | 97.9 /100 | #103 | Exceptional 65.1% |
| Spaniards | 97.8 /100 | #104 | Exceptional 65.1% |
| English | 97.4 /100 | #105 | Exceptional 65.1% |
| Whites/Caucasians | 97.3 /100 | #106 | Exceptional 65.1% |
| Alaska Natives | 97.3 /100 | #107 | Exceptional 65.1% |
| Palestinians | 97.2 /100 | #108 | Exceptional 65.1% |
| Immigrants | Guatemala | 96.9 /100 | #109 | Exceptional 65.0% |
| Scandinavians | 96.8 /100 | #110 | Exceptional 65.0% |
| Europeans | 96.8 /100 | #111 | Exceptional 65.0% |
| Immigrants | Jordan | 96.5 /100 | #112 | Exceptional 65.0% |
| Spanish | 96.2 /100 | #113 | Exceptional 65.0% |
| Argentineans | 95.7 /100 | #114 | Exceptional 65.0% |
| Ecuadorians | 95.4 /100 | #115 | Exceptional 65.0% |
| Immigrants | Iraq | 95.4 /100 | #116 | Exceptional 65.0% |
| Cherokee | 95.3 /100 | #117 | Exceptional 65.0% |
Demographics Similar to Immigrants from the Azores by Family Households
In terms of family households, the demographic groups most similar to Immigrants from the Azores are Immigrants from South America (65.6%, a difference of 0.010%), Yaqui (65.6%, a difference of 0.010%), Immigrants from Costa Rica (65.6%, a difference of 0.040%), Puget Sound Salish (65.6%, a difference of 0.060%), and Houma (65.7%, a difference of 0.12%).
| Demographics | Rating | Rank | Family Households |
| Malaysians | 99.9 /100 | #69 | Exceptional 65.9% |
| Immigrants | Afghanistan | 99.9 /100 | #70 | Exceptional 65.9% |
| Bhutanese | 99.9 /100 | #71 | Exceptional 65.9% |
| Portuguese | 99.9 /100 | #72 | Exceptional 65.8% |
| Laotians | 99.9 /100 | #73 | Exceptional 65.8% |
| Burmese | 99.9 /100 | #74 | Exceptional 65.7% |
| Houma | 99.9 /100 | #75 | Exceptional 65.7% |
| Immigrants | Azores | 99.8 /100 | #76 | Exceptional 65.6% |
| Immigrants | South America | 99.8 /100 | #77 | Exceptional 65.6% |
| Yaqui | 99.8 /100 | #78 | Exceptional 65.6% |
| Immigrants | Costa Rica | 99.8 /100 | #79 | Exceptional 65.6% |
| Puget Sound Salish | 99.8 /100 | #80 | Exceptional 65.6% |
| Jordanians | 99.7 /100 | #81 | Exceptional 65.5% |
| Immigrants | Lebanon | 99.7 /100 | #82 | Exceptional 65.5% |
| Immigrants | Guyana | 99.6 /100 | #83 | Exceptional 65.5% |