Turkish vs Immigrants from Norway Average Family Size
COMPARE
Turkish
Immigrants from Norway
Average Family Size
Average Family Size Comparison
Turks
Immigrants from Norway
3.16
AVERAGE FAMILY SIZE
1.3/ 100
METRIC RATING
258th/ 347
METRIC RANK
3.14
AVERAGE FAMILY SIZE
0.3/ 100
METRIC RATING
289th/ 347
METRIC RANK
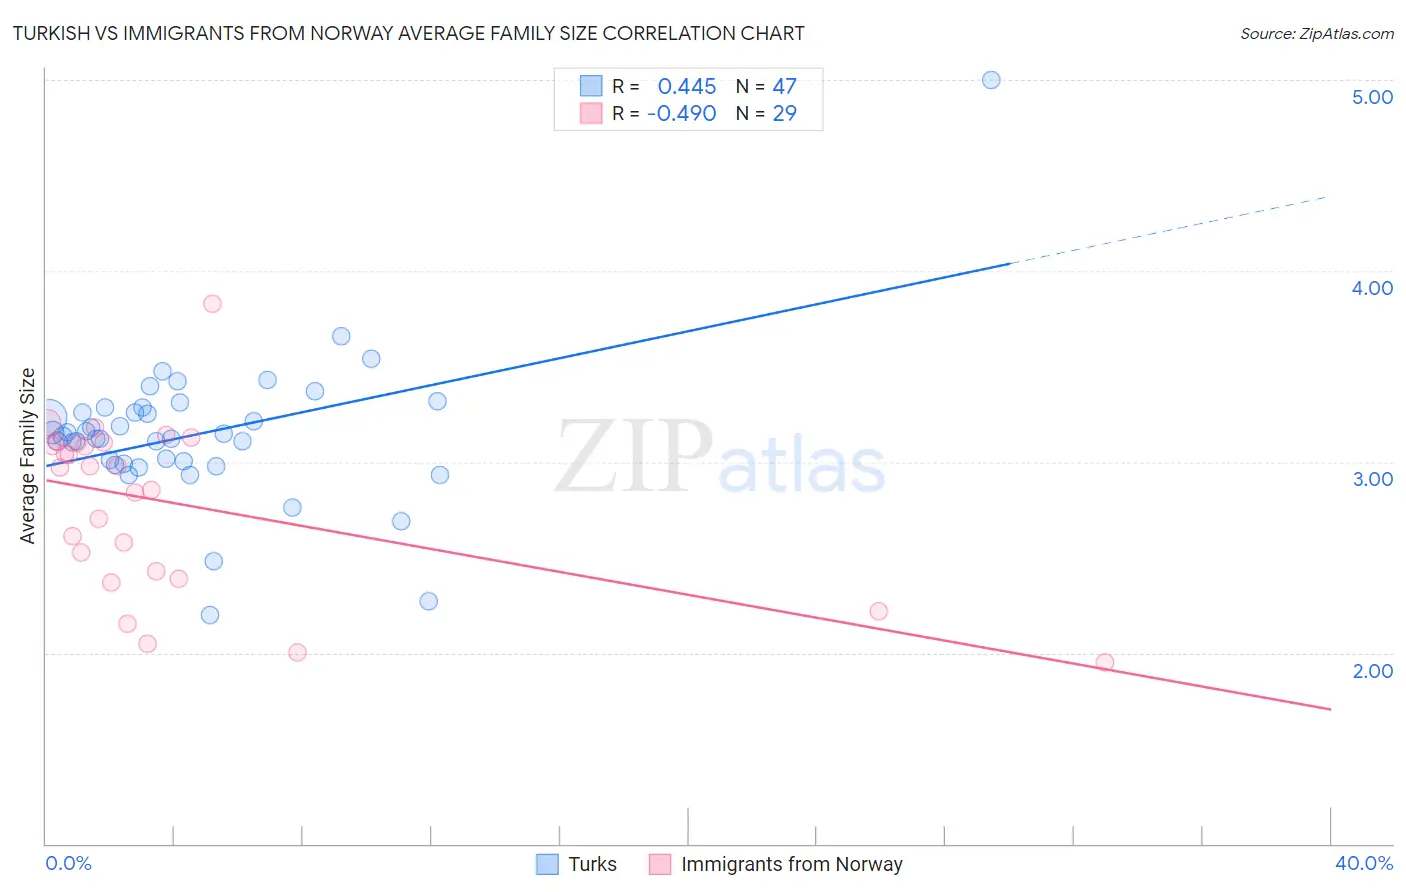
Turkish vs Immigrants from Norway Average Family Size Correlation Chart
The statistical analysis conducted on geographies consisting of 271,710,663 people shows a moderate positive correlation between the proportion of Turks and average family size in the United States with a correlation coefficient (R) of 0.445 and weighted average of 3.16. Similarly, the statistical analysis conducted on geographies consisting of 116,686,104 people shows a moderate negative correlation between the proportion of Immigrants from Norway and average family size in the United States with a correlation coefficient (R) of -0.490 and weighted average of 3.14, a difference of 0.72%.
Average Family Size Correlation Summary
| Measurement | Turkish | Immigrants from Norway |
| Minimum | 2.20 | 1.95 |
| Maximum | 5.00 | 3.83 |
| Range | 2.80 | 1.88 |
| Mean | 3.15 | 2.78 |
| Median | 3.13 | 2.97 |
| Interquartile 25% (IQ1) | 2.99 | 2.41 |
| Interquartile 75% (IQ3) | 3.28 | 3.10 |
| Interquartile Range (IQR) | 0.29 | 0.69 |
| Standard Deviation (Sample) | 0.39 | 0.45 |
| Standard Deviation (Population) | 0.39 | 0.44 |
Similar Demographics by Average Family Size
Demographics Similar to Turks by Average Family Size
In terms of average family size, the demographic groups most similar to Turks are Potawatomi (3.16, a difference of 0.0%), Immigrants from Albania (3.16, a difference of 0.010%), Immigrants from North Macedonia (3.16, a difference of 0.010%), Immigrants from Russia (3.16, a difference of 0.020%), and Albanian (3.17, a difference of 0.050%).
| Demographics | Rating | Rank | Average Family Size |
| Immigrants | Spain | 1.8 /100 | #251 | Tragic 3.17 |
| Immigrants | Saudi Arabia | 1.7 /100 | #252 | Tragic 3.17 |
| South Africans | 1.7 /100 | #253 | Tragic 3.17 |
| Immigrants | Hungary | 1.7 /100 | #254 | Tragic 3.17 |
| Cape Verdeans | 1.6 /100 | #255 | Tragic 3.17 |
| Immigrants | Kazakhstan | 1.5 /100 | #256 | Tragic 3.17 |
| Albanians | 1.5 /100 | #257 | Tragic 3.17 |
| Turks | 1.3 /100 | #258 | Tragic 3.16 |
| Potawatomi | 1.3 /100 | #259 | Tragic 3.16 |
| Immigrants | Albania | 1.3 /100 | #260 | Tragic 3.16 |
| Immigrants | North Macedonia | 1.3 /100 | #261 | Tragic 3.16 |
| Immigrants | Russia | 1.3 /100 | #262 | Tragic 3.16 |
| Immigrants | Bulgaria | 1.0 /100 | #263 | Tragic 3.16 |
| Americans | 1.0 /100 | #264 | Tragic 3.16 |
| Immigrants | South Africa | 0.9 /100 | #265 | Tragic 3.16 |
Demographics Similar to Immigrants from Norway by Average Family Size
In terms of average family size, the demographic groups most similar to Immigrants from Norway are Greek (3.14, a difference of 0.0%), Immigrants from Czechoslovakia (3.14, a difference of 0.0%), Immigrants from Netherlands (3.14, a difference of 0.010%), Cypriot (3.14, a difference of 0.030%), and White/Caucasian (3.14, a difference of 0.060%).
| Demographics | Rating | Rank | Average Family Size |
| Yugoslavians | 0.4 /100 | #282 | Tragic 3.15 |
| German Russians | 0.4 /100 | #283 | Tragic 3.15 |
| Immigrants | France | 0.4 /100 | #284 | Tragic 3.15 |
| Whites/Caucasians | 0.3 /100 | #285 | Tragic 3.14 |
| Immigrants | Netherlands | 0.3 /100 | #286 | Tragic 3.14 |
| Greeks | 0.3 /100 | #287 | Tragic 3.14 |
| Immigrants | Czechoslovakia | 0.3 /100 | #288 | Tragic 3.14 |
| Immigrants | Norway | 0.3 /100 | #289 | Tragic 3.14 |
| Cypriots | 0.3 /100 | #290 | Tragic 3.14 |
| Alsatians | 0.2 /100 | #291 | Tragic 3.14 |
| Europeans | 0.2 /100 | #292 | Tragic 3.14 |
| Scandinavians | 0.2 /100 | #293 | Tragic 3.14 |
| Immigrants | Croatia | 0.2 /100 | #294 | Tragic 3.14 |
| Austrians | 0.2 /100 | #295 | Tragic 3.14 |
| Ukrainians | 0.2 /100 | #296 | Tragic 3.14 |