Pima vs Immigrants from Cuba Average Family Size
COMPARE
Pima
Immigrants from Cuba
Average Family Size
Average Family Size Comparison
Pima
Immigrants from Cuba
3.75
AVERAGE FAMILY SIZE
100/ 100
METRIC RATING
4th/ 347
METRIC RANK
3.26
AVERAGE FAMILY SIZE
91.3/ 100
METRIC RATING
125th/ 347
METRIC RANK
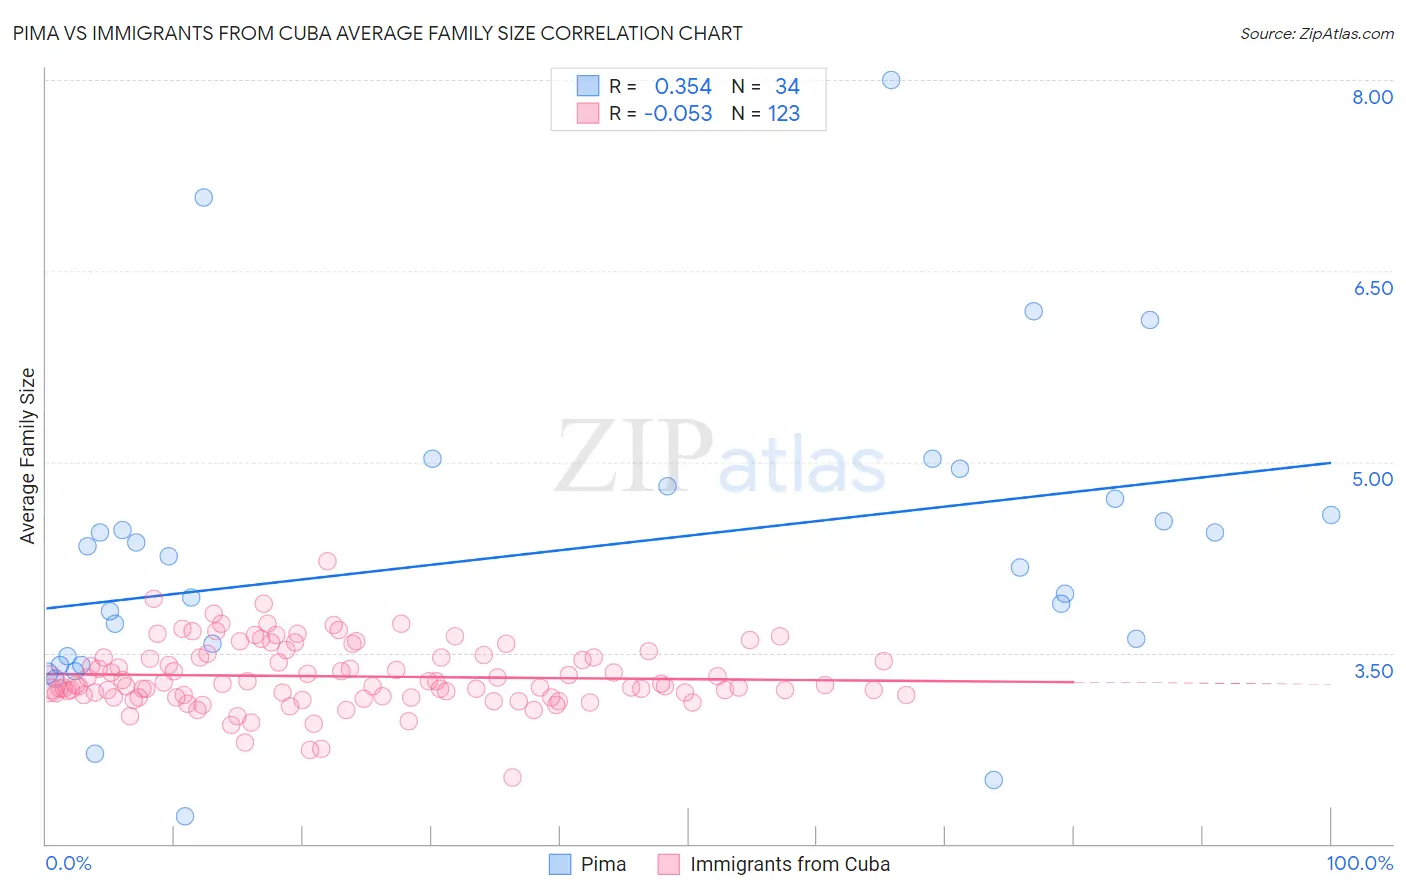
Pima vs Immigrants from Cuba Average Family Size Correlation Chart
The statistical analysis conducted on geographies consisting of 61,539,566 people shows a mild positive correlation between the proportion of Pima and average family size in the United States with a correlation coefficient (R) of 0.354 and weighted average of 3.75. Similarly, the statistical analysis conducted on geographies consisting of 325,939,675 people shows a slight negative correlation between the proportion of Immigrants from Cuba and average family size in the United States with a correlation coefficient (R) of -0.053 and weighted average of 3.26, a difference of 14.8%.
Average Family Size Correlation Summary
| Measurement | Pima | Immigrants from Cuba |
| Minimum | 2.22 | 2.52 |
| Maximum | 8.00 | 4.22 |
| Range | 5.78 | 1.70 |
| Mean | 4.29 | 3.31 |
| Median | 4.21 | 3.25 |
| Interquartile 25% (IQ1) | 3.48 | 3.16 |
| Interquartile 75% (IQ3) | 4.71 | 3.47 |
| Interquartile Range (IQR) | 1.23 | 0.31 |
| Standard Deviation (Sample) | 1.20 | 0.26 |
| Standard Deviation (Population) | 1.18 | 0.26 |
Similar Demographics by Average Family Size
Demographics Similar to Pima by Average Family Size
In terms of average family size, the demographic groups most similar to Pima are Pueblo (3.79, a difference of 1.3%), Crow (3.82, a difference of 2.1%), Navajo (3.65, a difference of 2.8%), Arapaho (3.64, a difference of 3.1%), and Inupiat (3.63, a difference of 3.3%).
| Demographics | Rating | Rank | Average Family Size |
| Yup'ik | 100 /100 | #1 | Exceptional 4.00 |
| Crow | 100 /100 | #2 | Exceptional 3.82 |
| Pueblo | 100 /100 | #3 | Exceptional 3.79 |
| Pima | 100 /100 | #4 | Exceptional 3.75 |
| Navajo | 100.0 /100 | #5 | Exceptional 3.65 |
| Arapaho | 100.0 /100 | #6 | Exceptional 3.64 |
| Inupiat | 100.0 /100 | #7 | Exceptional 3.63 |
| Immigrants | Yemen | 100.0 /100 | #8 | Exceptional 3.60 |
| Hopi | 100.0 /100 | #9 | Exceptional 3.60 |
| Spanish American Indians | 100.0 /100 | #10 | Exceptional 3.58 |
| Tohono O'odham | 100.0 /100 | #11 | Exceptional 3.53 |
| Immigrants | Mexico | 100.0 /100 | #12 | Exceptional 3.52 |
| Sioux | 100.0 /100 | #13 | Exceptional 3.52 |
| Immigrants | Central America | 100.0 /100 | #14 | Exceptional 3.49 |
| Tongans | 100.0 /100 | #15 | Exceptional 3.49 |
Demographics Similar to Immigrants from Cuba by Average Family Size
In terms of average family size, the demographic groups most similar to Immigrants from Cuba are South American Indian (3.26, a difference of 0.020%), Immigrants from Costa Rica (3.26, a difference of 0.030%), Immigrants from Syria (3.26, a difference of 0.040%), Alaskan Athabascan (3.27, a difference of 0.070%), and Colombian (3.26, a difference of 0.080%).
| Demographics | Rating | Rank | Average Family Size |
| Immigrants | Asia | 94.0 /100 | #118 | Exceptional 3.27 |
| Immigrants | Indonesia | 93.7 /100 | #119 | Exceptional 3.27 |
| Immigrants | Bahamas | 93.6 /100 | #120 | Exceptional 3.27 |
| Immigrants | Thailand | 93.3 /100 | #121 | Exceptional 3.27 |
| Immigrants | Colombia | 92.8 /100 | #122 | Exceptional 3.27 |
| Alaskan Athabascans | 92.4 /100 | #123 | Exceptional 3.27 |
| South American Indians | 91.6 /100 | #124 | Exceptional 3.26 |
| Immigrants | Cuba | 91.3 /100 | #125 | Exceptional 3.26 |
| Immigrants | Costa Rica | 90.7 /100 | #126 | Exceptional 3.26 |
| Immigrants | Syria | 90.6 /100 | #127 | Exceptional 3.26 |
| Colombians | 89.9 /100 | #128 | Excellent 3.26 |
| Immigrants | Hong Kong | 88.6 /100 | #129 | Excellent 3.26 |
| Laotians | 88.5 /100 | #130 | Excellent 3.26 |
| Immigrants | Western Asia | 87.7 /100 | #131 | Excellent 3.26 |
| Costa Ricans | 86.8 /100 | #132 | Excellent 3.26 |