Panamanian vs Immigrants from Cuba Average Family Size
COMPARE
Panamanian
Immigrants from Cuba
Average Family Size
Average Family Size Comparison
Panamanians
Immigrants from Cuba
3.25
AVERAGE FAMILY SIZE
84.2/ 100
METRIC RATING
135th/ 347
METRIC RANK
3.26
AVERAGE FAMILY SIZE
91.3/ 100
METRIC RATING
125th/ 347
METRIC RANK
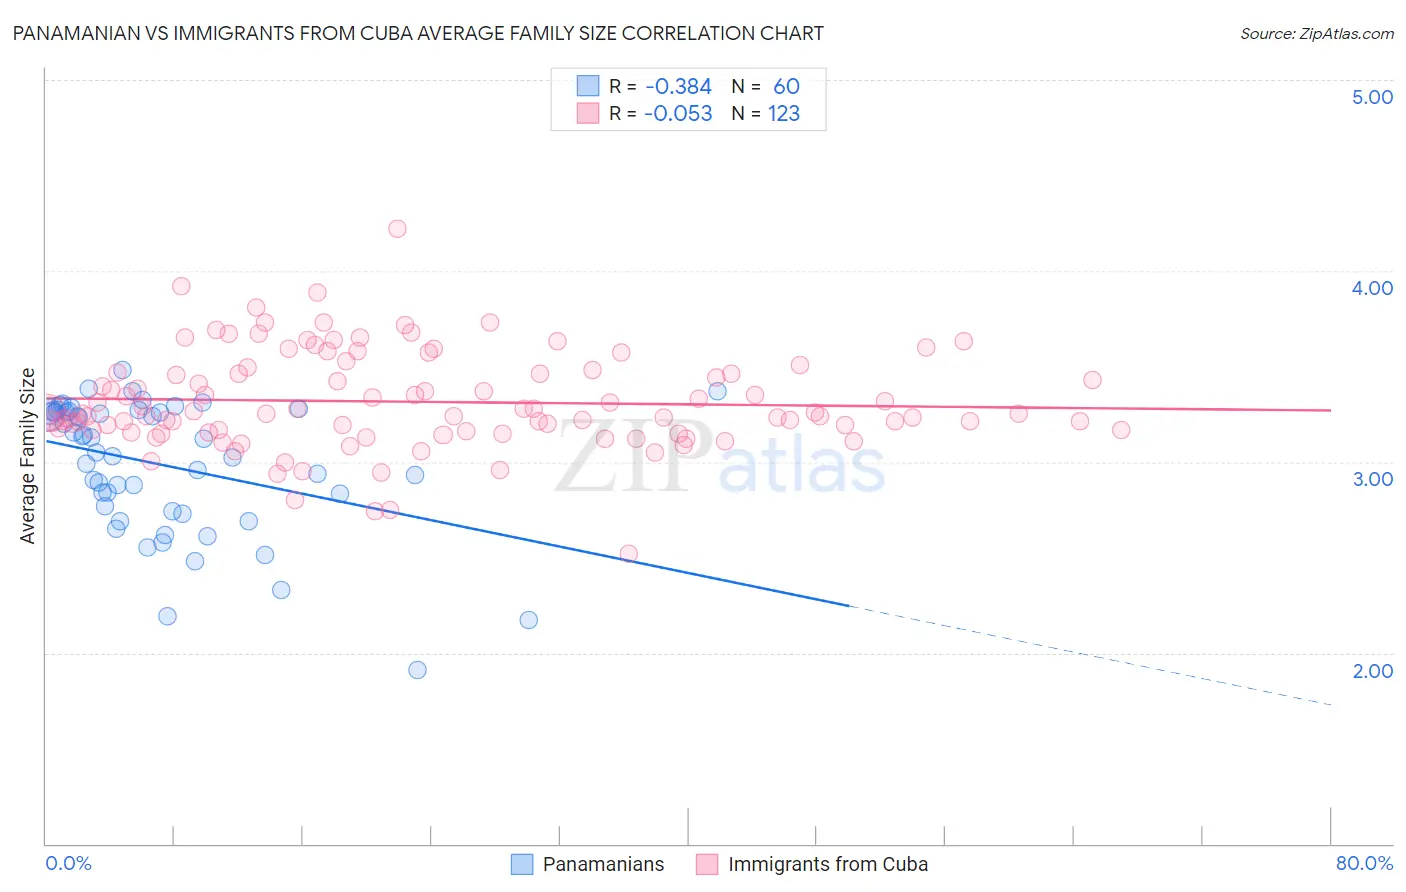
Panamanian vs Immigrants from Cuba Average Family Size Correlation Chart
The statistical analysis conducted on geographies consisting of 281,072,582 people shows a mild negative correlation between the proportion of Panamanians and average family size in the United States with a correlation coefficient (R) of -0.384 and weighted average of 3.25. Similarly, the statistical analysis conducted on geographies consisting of 325,939,675 people shows a slight negative correlation between the proportion of Immigrants from Cuba and average family size in the United States with a correlation coefficient (R) of -0.053 and weighted average of 3.26, a difference of 0.31%.
Average Family Size Correlation Summary
| Measurement | Panamanian | Immigrants from Cuba |
| Minimum | 1.91 | 2.52 |
| Maximum | 3.48 | 4.22 |
| Range | 1.57 | 1.70 |
| Mean | 2.98 | 3.31 |
| Median | 3.08 | 3.25 |
| Interquartile 25% (IQ1) | 2.75 | 3.16 |
| Interquartile 75% (IQ3) | 3.26 | 3.47 |
| Interquartile Range (IQR) | 0.51 | 0.31 |
| Standard Deviation (Sample) | 0.35 | 0.26 |
| Standard Deviation (Population) | 0.34 | 0.26 |
Demographics Similar to Panamanians and Immigrants from Cuba by Average Family Size
In terms of average family size, the demographic groups most similar to Panamanians are African (3.25, a difference of 0.020%), Comanche (3.25, a difference of 0.050%), Immigrants from Middle Africa (3.25, a difference of 0.060%), Immigrants from Venezuela (3.26, a difference of 0.070%), and Cuban (3.25, a difference of 0.080%). Similarly, the demographic groups most similar to Immigrants from Cuba are South American Indian (3.26, a difference of 0.020%), Immigrants from Costa Rica (3.26, a difference of 0.030%), Immigrants from Syria (3.26, a difference of 0.040%), Alaskan Athabascan (3.27, a difference of 0.070%), and Colombian (3.26, a difference of 0.080%).
| Demographics | Rating | Rank | Average Family Size |
| Immigrants | Bahamas | 93.6 /100 | #120 | Exceptional 3.27 |
| Immigrants | Thailand | 93.3 /100 | #121 | Exceptional 3.27 |
| Immigrants | Colombia | 92.8 /100 | #122 | Exceptional 3.27 |
| Alaskan Athabascans | 92.4 /100 | #123 | Exceptional 3.27 |
| South American Indians | 91.6 /100 | #124 | Exceptional 3.26 |
| Immigrants | Cuba | 91.3 /100 | #125 | Exceptional 3.26 |
| Immigrants | Costa Rica | 90.7 /100 | #126 | Exceptional 3.26 |
| Immigrants | Syria | 90.6 /100 | #127 | Exceptional 3.26 |
| Colombians | 89.9 /100 | #128 | Excellent 3.26 |
| Immigrants | Hong Kong | 88.6 /100 | #129 | Excellent 3.26 |
| Laotians | 88.5 /100 | #130 | Excellent 3.26 |
| Immigrants | Western Asia | 87.7 /100 | #131 | Excellent 3.26 |
| Costa Ricans | 86.8 /100 | #132 | Excellent 3.26 |
| Immigrants | Venezuela | 86.3 /100 | #133 | Excellent 3.26 |
| Africans | 84.9 /100 | #134 | Excellent 3.25 |
| Panamanians | 84.2 /100 | #135 | Excellent 3.25 |
| Comanche | 82.8 /100 | #136 | Excellent 3.25 |
| Immigrants | Middle Africa | 82.4 /100 | #137 | Excellent 3.25 |
| Cubans | 81.8 /100 | #138 | Excellent 3.25 |
| Immigrants | Ethiopia | 81.6 /100 | #139 | Excellent 3.25 |
| Sub-Saharan Africans | 81.6 /100 | #140 | Excellent 3.25 |