Black/African American vs Immigrants from Cuba Average Family Size
COMPARE
Black/African American
Immigrants from Cuba
Average Family Size
Average Family Size Comparison
Blacks/African Americans
Immigrants from Cuba
3.27
AVERAGE FAMILY SIZE
95.7/ 100
METRIC RATING
112th/ 347
METRIC RANK
3.26
AVERAGE FAMILY SIZE
91.3/ 100
METRIC RATING
125th/ 347
METRIC RANK
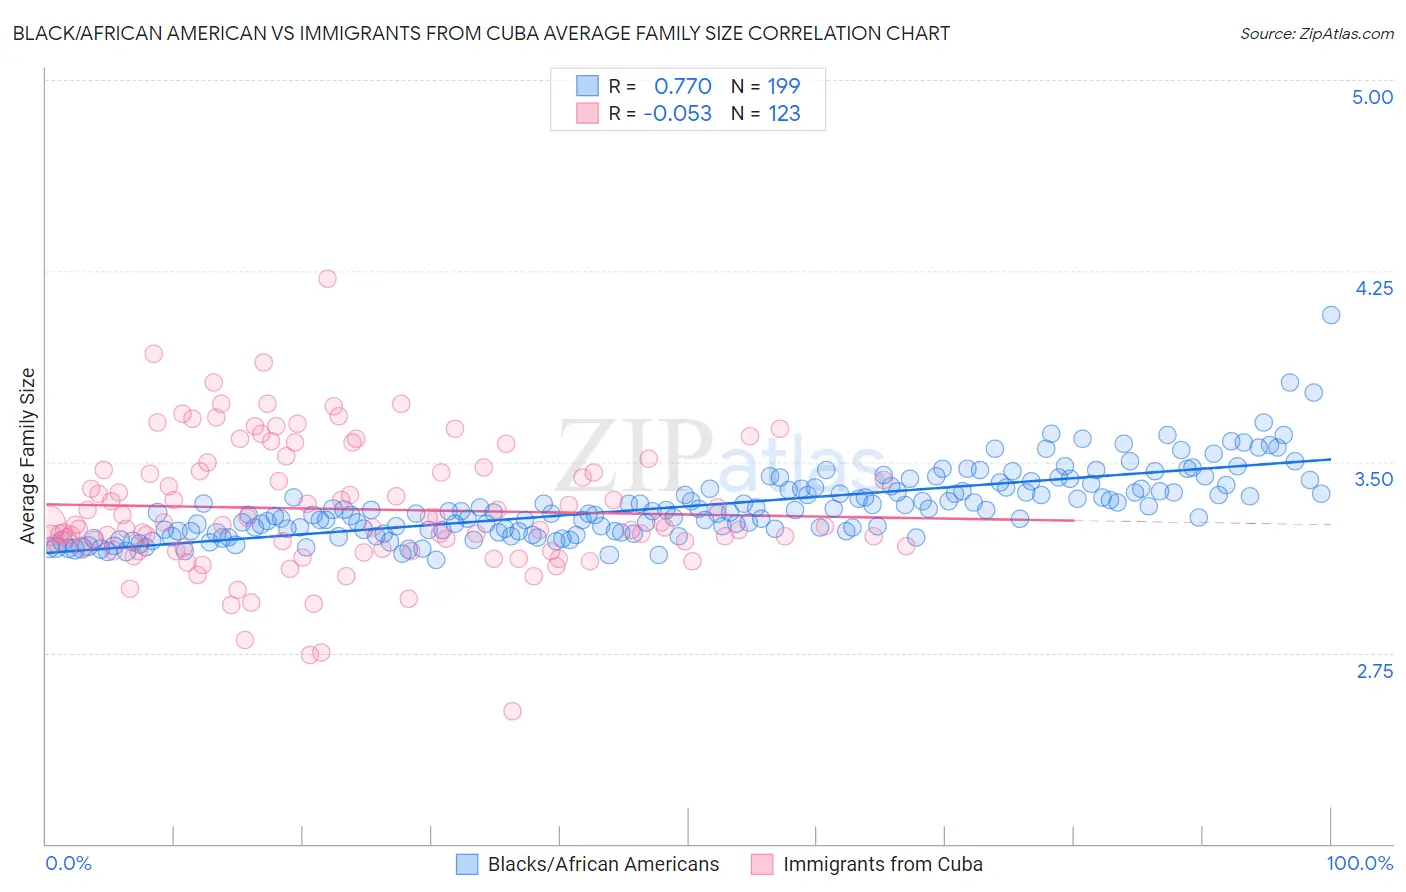
Black/African American vs Immigrants from Cuba Average Family Size Correlation Chart
The statistical analysis conducted on geographies consisting of 565,344,221 people shows a strong positive correlation between the proportion of Blacks/African Americans and average family size in the United States with a correlation coefficient (R) of 0.770 and weighted average of 3.27. Similarly, the statistical analysis conducted on geographies consisting of 325,939,675 people shows a slight negative correlation between the proportion of Immigrants from Cuba and average family size in the United States with a correlation coefficient (R) of -0.053 and weighted average of 3.26, a difference of 0.34%.
Average Family Size Correlation Summary
| Measurement | Black/African American | Immigrants from Cuba |
| Minimum | 3.12 | 2.52 |
| Maximum | 4.08 | 4.22 |
| Range | 0.96 | 1.70 |
| Mean | 3.33 | 3.31 |
| Median | 3.30 | 3.25 |
| Interquartile 25% (IQ1) | 3.23 | 3.16 |
| Interquartile 75% (IQ3) | 3.39 | 3.47 |
| Interquartile Range (IQR) | 0.16 | 0.31 |
| Standard Deviation (Sample) | 0.14 | 0.26 |
| Standard Deviation (Population) | 0.14 | 0.26 |
Demographics Similar to Blacks/African Americans and Immigrants from Cuba by Average Family Size
In terms of average family size, the demographic groups most similar to Blacks/African Americans are Immigrants from Panama (3.27, a difference of 0.010%), Indonesian (3.28, a difference of 0.060%), South American (3.27, a difference of 0.060%), Immigrants from Liberia (3.27, a difference of 0.070%), and Immigrants from South America (3.27, a difference of 0.070%). Similarly, the demographic groups most similar to Immigrants from Cuba are South American Indian (3.26, a difference of 0.020%), Immigrants from Costa Rica (3.26, a difference of 0.030%), Immigrants from Syria (3.26, a difference of 0.040%), Alaskan Athabascan (3.27, a difference of 0.070%), and Colombian (3.26, a difference of 0.080%).
| Demographics | Rating | Rank | Average Family Size |
| Asians | 97.0 /100 | #108 | Exceptional 3.28 |
| Puerto Ricans | 96.7 /100 | #109 | Exceptional 3.28 |
| Bahamians | 96.6 /100 | #110 | Exceptional 3.28 |
| Indonesians | 96.2 /100 | #111 | Exceptional 3.28 |
| Blacks/African Americans | 95.7 /100 | #112 | Exceptional 3.27 |
| Immigrants | Panama | 95.6 /100 | #113 | Exceptional 3.27 |
| South Americans | 95.1 /100 | #114 | Exceptional 3.27 |
| Immigrants | Liberia | 95.0 /100 | #115 | Exceptional 3.27 |
| Immigrants | South America | 95.0 /100 | #116 | Exceptional 3.27 |
| Kiowa | 94.8 /100 | #117 | Exceptional 3.27 |
| Immigrants | Asia | 94.0 /100 | #118 | Exceptional 3.27 |
| Immigrants | Indonesia | 93.7 /100 | #119 | Exceptional 3.27 |
| Immigrants | Bahamas | 93.6 /100 | #120 | Exceptional 3.27 |
| Immigrants | Thailand | 93.3 /100 | #121 | Exceptional 3.27 |
| Immigrants | Colombia | 92.8 /100 | #122 | Exceptional 3.27 |
| Alaskan Athabascans | 92.4 /100 | #123 | Exceptional 3.27 |
| South American Indians | 91.6 /100 | #124 | Exceptional 3.26 |
| Immigrants | Cuba | 91.3 /100 | #125 | Exceptional 3.26 |
| Immigrants | Costa Rica | 90.7 /100 | #126 | Exceptional 3.26 |
| Immigrants | Syria | 90.6 /100 | #127 | Exceptional 3.26 |
| Colombians | 89.9 /100 | #128 | Excellent 3.26 |