Assyrian/Chaldean/Syriac vs Immigrants from Albania Average Family Size
COMPARE
Assyrian/Chaldean/Syriac
Immigrants from Albania
Average Family Size
Average Family Size Comparison
Assyrians/Chaldeans/Syriacs
Immigrants from Albania
3.24
AVERAGE FAMILY SIZE
73.8/ 100
METRIC RATING
149th/ 347
METRIC RANK
3.16
AVERAGE FAMILY SIZE
1.3/ 100
METRIC RATING
260th/ 347
METRIC RANK
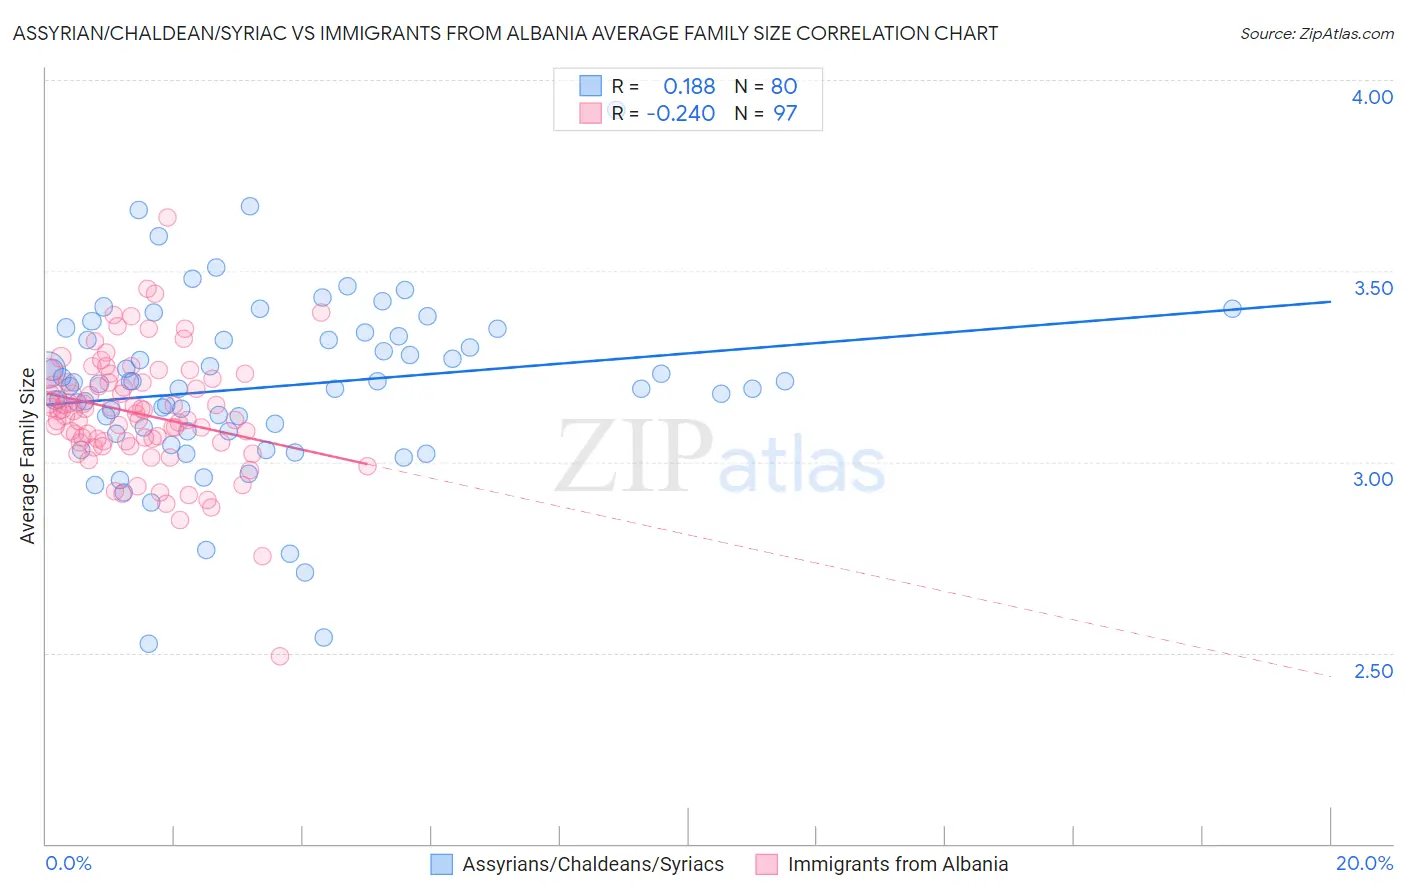
Assyrian/Chaldean/Syriac vs Immigrants from Albania Average Family Size Correlation Chart
The statistical analysis conducted on geographies consisting of 110,294,582 people shows a poor positive correlation between the proportion of Assyrians/Chaldeans/Syriacs and average family size in the United States with a correlation coefficient (R) of 0.188 and weighted average of 3.24. Similarly, the statistical analysis conducted on geographies consisting of 119,382,596 people shows a weak negative correlation between the proportion of Immigrants from Albania and average family size in the United States with a correlation coefficient (R) of -0.240 and weighted average of 3.16, a difference of 2.5%.
Average Family Size Correlation Summary
| Measurement | Assyrian/Chaldean/Syriac | Immigrants from Albania |
| Minimum | 2.52 | 2.49 |
| Maximum | 3.92 | 3.64 |
| Range | 1.40 | 1.15 |
| Mean | 3.20 | 3.13 |
| Median | 3.20 | 3.13 |
| Interquartile 25% (IQ1) | 3.08 | 3.05 |
| Interquartile 75% (IQ3) | 3.33 | 3.21 |
| Interquartile Range (IQR) | 0.25 | 0.16 |
| Standard Deviation (Sample) | 0.23 | 0.16 |
| Standard Deviation (Population) | 0.23 | 0.16 |
Similar Demographics by Average Family Size
Demographics Similar to Assyrians/Chaldeans/Syriacs by Average Family Size
In terms of average family size, the demographic groups most similar to Assyrians/Chaldeans/Syriacs are Indian (Asian) (3.24, a difference of 0.0%), Jordanian (3.24, a difference of 0.010%), Blackfeet (3.24, a difference of 0.030%), Spanish American (3.24, a difference of 0.030%), and Immigrants from Jordan (3.24, a difference of 0.050%).
| Demographics | Rating | Rank | Average Family Size |
| Liberians | 81.2 /100 | #142 | Excellent 3.25 |
| Bhutanese | 81.0 /100 | #143 | Excellent 3.25 |
| Tsimshian | 80.2 /100 | #144 | Excellent 3.25 |
| Armenians | 78.2 /100 | #145 | Good 3.25 |
| Immigrants | Africa | 77.9 /100 | #146 | Good 3.25 |
| Immigrants | Jordan | 75.7 /100 | #147 | Good 3.24 |
| Blackfeet | 75.0 /100 | #148 | Good 3.24 |
| Assyrians/Chaldeans/Syriacs | 73.8 /100 | #149 | Good 3.24 |
| Indians (Asian) | 73.6 /100 | #150 | Good 3.24 |
| Jordanians | 73.5 /100 | #151 | Good 3.24 |
| Spanish Americans | 72.5 /100 | #152 | Good 3.24 |
| Immigrants | Eritrea | 71.4 /100 | #153 | Good 3.24 |
| Immigrants | Egypt | 70.0 /100 | #154 | Good 3.24 |
| Seminole | 68.2 /100 | #155 | Good 3.24 |
| Immigrants | Taiwan | 68.1 /100 | #156 | Good 3.24 |
Demographics Similar to Immigrants from Albania by Average Family Size
In terms of average family size, the demographic groups most similar to Immigrants from Albania are Potawatomi (3.16, a difference of 0.0%), Turkish (3.16, a difference of 0.010%), Immigrants from North Macedonia (3.16, a difference of 0.010%), Immigrants from Russia (3.16, a difference of 0.010%), and Albanian (3.17, a difference of 0.060%).
| Demographics | Rating | Rank | Average Family Size |
| South Africans | 1.7 /100 | #253 | Tragic 3.17 |
| Immigrants | Hungary | 1.7 /100 | #254 | Tragic 3.17 |
| Cape Verdeans | 1.6 /100 | #255 | Tragic 3.17 |
| Immigrants | Kazakhstan | 1.5 /100 | #256 | Tragic 3.17 |
| Albanians | 1.5 /100 | #257 | Tragic 3.17 |
| Turks | 1.3 /100 | #258 | Tragic 3.16 |
| Potawatomi | 1.3 /100 | #259 | Tragic 3.16 |
| Immigrants | Albania | 1.3 /100 | #260 | Tragic 3.16 |
| Immigrants | North Macedonia | 1.3 /100 | #261 | Tragic 3.16 |
| Immigrants | Russia | 1.3 /100 | #262 | Tragic 3.16 |
| Immigrants | Bulgaria | 1.0 /100 | #263 | Tragic 3.16 |
| Americans | 1.0 /100 | #264 | Tragic 3.16 |
| Immigrants | South Africa | 0.9 /100 | #265 | Tragic 3.16 |
| Immigrants | Greece | 0.9 /100 | #266 | Tragic 3.16 |
| Iroquois | 0.8 /100 | #267 | Tragic 3.16 |