Spanish American vs Immigrants from Albania Average Family Size
COMPARE
Spanish American
Immigrants from Albania
Average Family Size
Average Family Size Comparison
Spanish Americans
Immigrants from Albania
3.24
AVERAGE FAMILY SIZE
72.5/ 100
METRIC RATING
152nd/ 347
METRIC RANK
3.16
AVERAGE FAMILY SIZE
1.3/ 100
METRIC RATING
260th/ 347
METRIC RANK
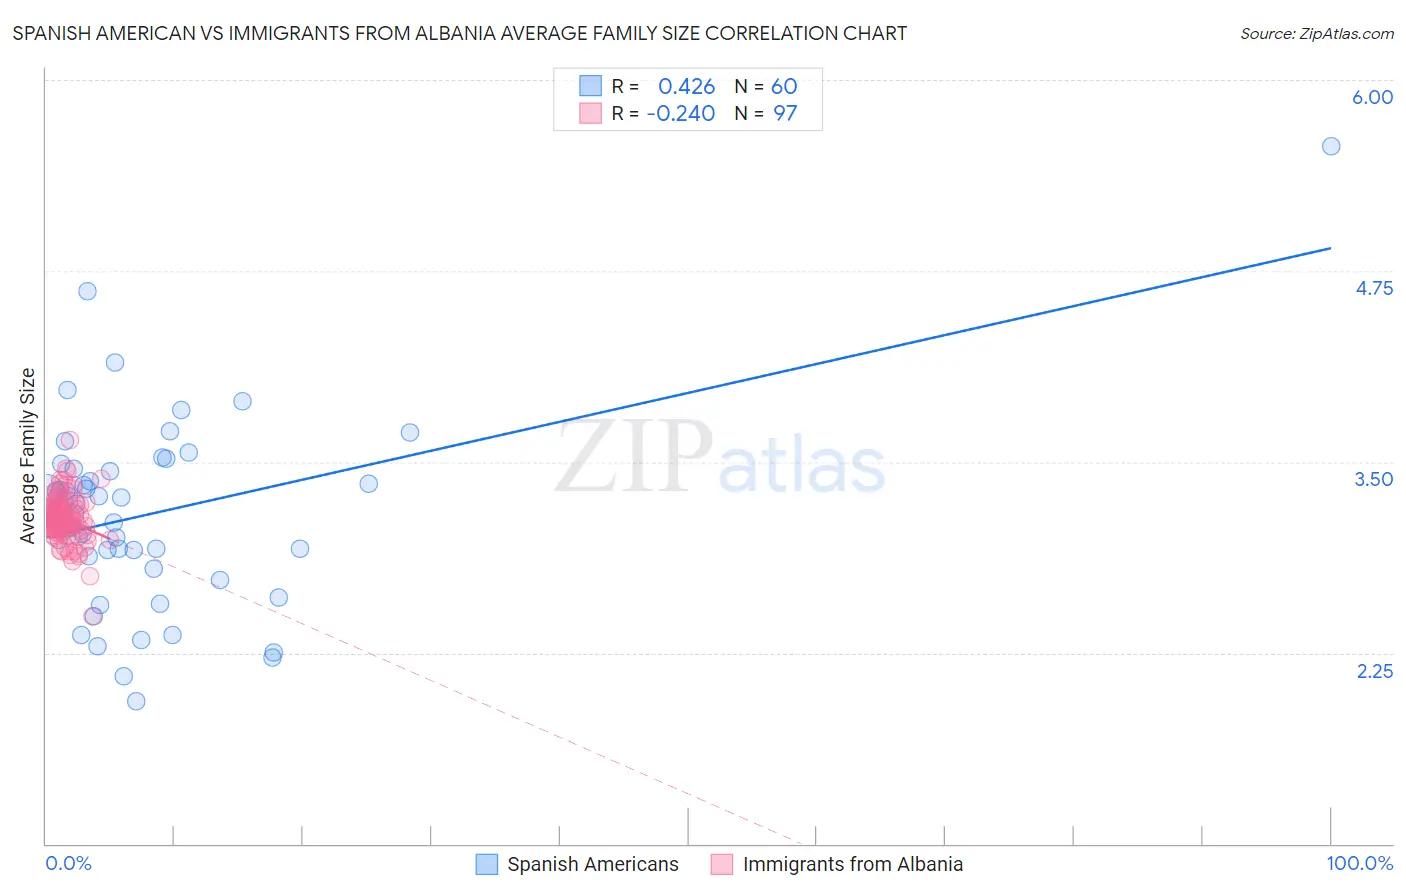
Spanish American vs Immigrants from Albania Average Family Size Correlation Chart
The statistical analysis conducted on geographies consisting of 103,168,621 people shows a moderate positive correlation between the proportion of Spanish Americans and average family size in the United States with a correlation coefficient (R) of 0.426 and weighted average of 3.24. Similarly, the statistical analysis conducted on geographies consisting of 119,382,596 people shows a weak negative correlation between the proportion of Immigrants from Albania and average family size in the United States with a correlation coefficient (R) of -0.240 and weighted average of 3.16, a difference of 2.5%.
Average Family Size Correlation Summary
| Measurement | Spanish American | Immigrants from Albania |
| Minimum | 1.93 | 2.49 |
| Maximum | 5.56 | 3.64 |
| Range | 3.63 | 1.15 |
| Mean | 3.15 | 3.13 |
| Median | 3.17 | 3.13 |
| Interquartile 25% (IQ1) | 2.90 | 3.05 |
| Interquartile 75% (IQ3) | 3.41 | 3.21 |
| Interquartile Range (IQR) | 0.51 | 0.16 |
| Standard Deviation (Sample) | 0.61 | 0.16 |
| Standard Deviation (Population) | 0.60 | 0.16 |
Similar Demographics by Average Family Size
Demographics Similar to Spanish Americans by Average Family Size
In terms of average family size, the demographic groups most similar to Spanish Americans are Jordanian (3.24, a difference of 0.020%), Immigrants from Eritrea (3.24, a difference of 0.020%), Assyrian/Chaldean/Syriac (3.24, a difference of 0.030%), Indian (Asian) (3.24, a difference of 0.030%), and Blackfeet (3.24, a difference of 0.060%).
| Demographics | Rating | Rank | Average Family Size |
| Armenians | 78.2 /100 | #145 | Good 3.25 |
| Immigrants | Africa | 77.9 /100 | #146 | Good 3.25 |
| Immigrants | Jordan | 75.7 /100 | #147 | Good 3.24 |
| Blackfeet | 75.0 /100 | #148 | Good 3.24 |
| Assyrians/Chaldeans/Syriacs | 73.8 /100 | #149 | Good 3.24 |
| Indians (Asian) | 73.6 /100 | #150 | Good 3.24 |
| Jordanians | 73.5 /100 | #151 | Good 3.24 |
| Spanish Americans | 72.5 /100 | #152 | Good 3.24 |
| Immigrants | Eritrea | 71.4 /100 | #153 | Good 3.24 |
| Immigrants | Egypt | 70.0 /100 | #154 | Good 3.24 |
| Seminole | 68.2 /100 | #155 | Good 3.24 |
| Immigrants | Taiwan | 68.1 /100 | #156 | Good 3.24 |
| Immigrants | Uzbekistan | 67.0 /100 | #157 | Good 3.24 |
| Iraqis | 64.3 /100 | #158 | Good 3.24 |
| Ethiopians | 63.9 /100 | #159 | Good 3.24 |
Demographics Similar to Immigrants from Albania by Average Family Size
In terms of average family size, the demographic groups most similar to Immigrants from Albania are Potawatomi (3.16, a difference of 0.0%), Turkish (3.16, a difference of 0.010%), Immigrants from North Macedonia (3.16, a difference of 0.010%), Immigrants from Russia (3.16, a difference of 0.010%), and Albanian (3.17, a difference of 0.060%).
| Demographics | Rating | Rank | Average Family Size |
| South Africans | 1.7 /100 | #253 | Tragic 3.17 |
| Immigrants | Hungary | 1.7 /100 | #254 | Tragic 3.17 |
| Cape Verdeans | 1.6 /100 | #255 | Tragic 3.17 |
| Immigrants | Kazakhstan | 1.5 /100 | #256 | Tragic 3.17 |
| Albanians | 1.5 /100 | #257 | Tragic 3.17 |
| Turks | 1.3 /100 | #258 | Tragic 3.16 |
| Potawatomi | 1.3 /100 | #259 | Tragic 3.16 |
| Immigrants | Albania | 1.3 /100 | #260 | Tragic 3.16 |
| Immigrants | North Macedonia | 1.3 /100 | #261 | Tragic 3.16 |
| Immigrants | Russia | 1.3 /100 | #262 | Tragic 3.16 |
| Immigrants | Bulgaria | 1.0 /100 | #263 | Tragic 3.16 |
| Americans | 1.0 /100 | #264 | Tragic 3.16 |
| Immigrants | South Africa | 0.9 /100 | #265 | Tragic 3.16 |
| Immigrants | Greece | 0.9 /100 | #266 | Tragic 3.16 |
| Iroquois | 0.8 /100 | #267 | Tragic 3.16 |