Pakistani vs Immigrants from Albania Median Earnings
COMPARE
Pakistani
Immigrants from Albania
Median Earnings
Median Earnings Comparison
Pakistanis
Immigrants from Albania
$48,254
MEDIAN EARNINGS
92.8/ 100
METRIC RATING
129th/ 347
METRIC RANK
$49,377
MEDIAN EARNINGS
98.4/ 100
METRIC RATING
106th/ 347
METRIC RANK
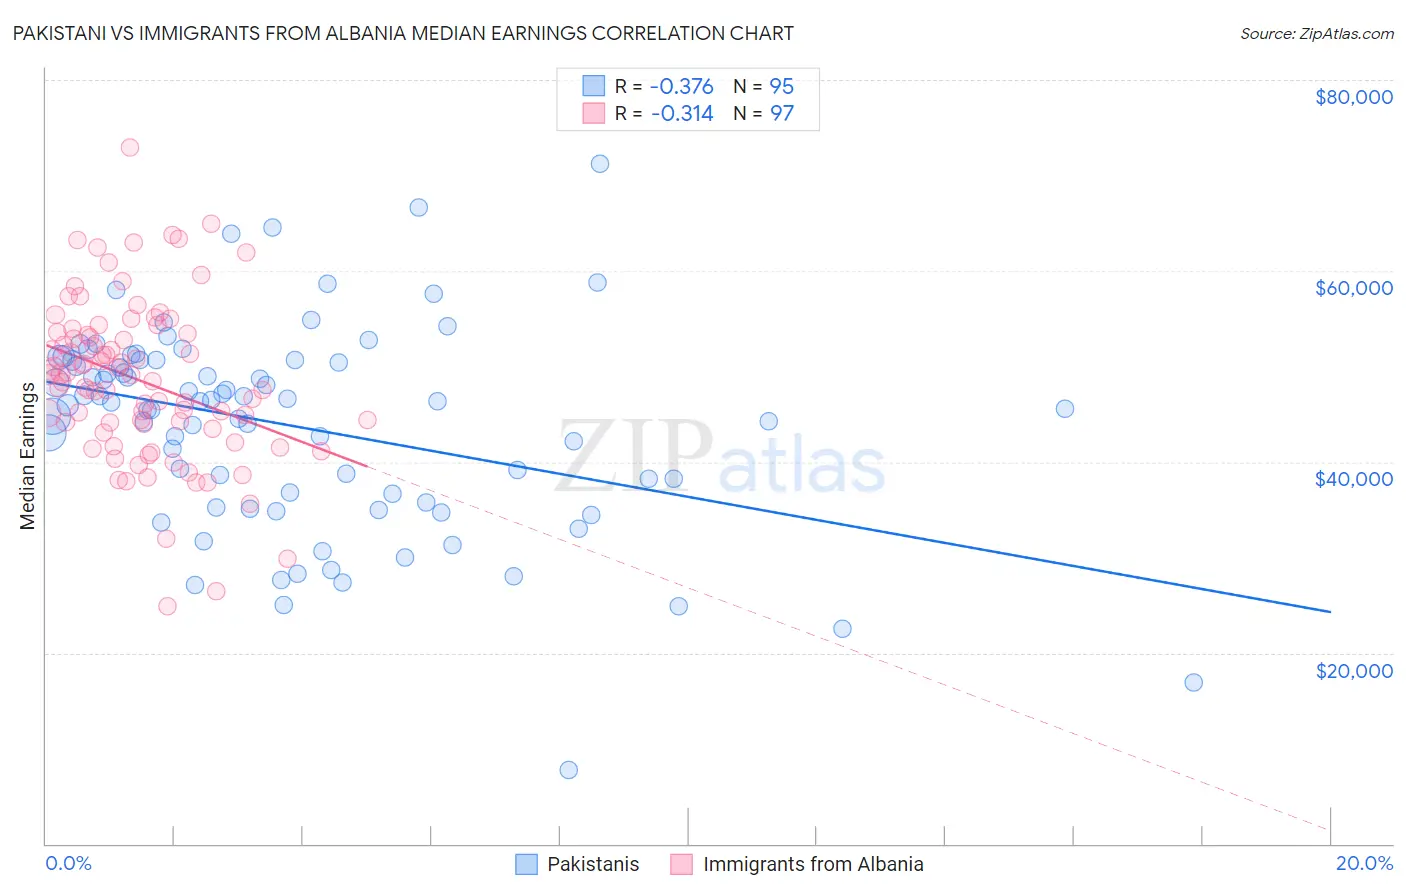
Pakistani vs Immigrants from Albania Median Earnings Correlation Chart
The statistical analysis conducted on geographies consisting of 335,344,487 people shows a mild negative correlation between the proportion of Pakistanis and median earnings in the United States with a correlation coefficient (R) of -0.376 and weighted average of $48,254. Similarly, the statistical analysis conducted on geographies consisting of 119,374,526 people shows a mild negative correlation between the proportion of Immigrants from Albania and median earnings in the United States with a correlation coefficient (R) of -0.314 and weighted average of $49,377, a difference of 2.3%.
Median Earnings Correlation Summary
| Measurement | Pakistani | Immigrants from Albania |
| Minimum | $7,703 | $24,914 |
| Maximum | $71,250 | $72,899 |
| Range | $63,547 | $47,985 |
| Mean | $43,723 | $48,556 |
| Median | $46,169 | $49,058 |
| Interquartile 25% (IQ1) | $35,714 | $43,717 |
| Interquartile 75% (IQ3) | $50,670 | $53,495 |
| Interquartile Range (IQR) | $14,956 | $9,778 |
| Standard Deviation (Sample) | $10,826 | $8,407 |
| Standard Deviation (Population) | $10,769 | $8,364 |
Similar Demographics by Median Earnings
Demographics Similar to Pakistanis by Median Earnings
In terms of median earnings, the demographic groups most similar to Pakistanis are Immigrants from Philippines ($48,266, a difference of 0.020%), Zimbabwean ($48,229, a difference of 0.050%), Lebanese ($48,226, a difference of 0.060%), Sierra Leonean ($48,286, a difference of 0.070%), and Assyrian/Chaldean/Syriac ($48,304, a difference of 0.10%).
| Demographics | Rating | Rank | Median Earnings |
| Chileans | 94.8 /100 | #122 | Exceptional $48,504 |
| Immigrants | Syria | 93.9 /100 | #123 | Exceptional $48,375 |
| Brazilians | 93.7 /100 | #124 | Exceptional $48,356 |
| Immigrants | Fiji | 93.3 /100 | #125 | Exceptional $48,305 |
| Assyrians/Chaldeans/Syriacs | 93.3 /100 | #126 | Exceptional $48,304 |
| Sierra Leoneans | 93.1 /100 | #127 | Exceptional $48,286 |
| Immigrants | Philippines | 92.9 /100 | #128 | Exceptional $48,266 |
| Pakistanis | 92.8 /100 | #129 | Exceptional $48,254 |
| Zimbabweans | 92.6 /100 | #130 | Exceptional $48,229 |
| Lebanese | 92.5 /100 | #131 | Exceptional $48,226 |
| British | 92.2 /100 | #132 | Exceptional $48,189 |
| Immigrants | Uganda | 90.5 /100 | #133 | Exceptional $48,041 |
| Sri Lankans | 90.5 /100 | #134 | Exceptional $48,040 |
| Portuguese | 90.4 /100 | #135 | Exceptional $48,032 |
| Slovenes | 90.0 /100 | #136 | Excellent $47,995 |
Demographics Similar to Immigrants from Albania by Median Earnings
In terms of median earnings, the demographic groups most similar to Immigrants from Albania are Immigrants from Western Asia ($49,389, a difference of 0.020%), Immigrants from Morocco ($49,368, a difference of 0.020%), Immigrants from Brazil ($49,463, a difference of 0.17%), Austrian ($49,501, a difference of 0.25%), and Palestinian ($49,209, a difference of 0.34%).
| Demographics | Rating | Rank | Median Earnings |
| Immigrants | Afghanistan | 98.9 /100 | #99 | Exceptional $49,645 |
| Immigrants | Poland | 98.9 /100 | #100 | Exceptional $49,633 |
| Jordanians | 98.9 /100 | #101 | Exceptional $49,632 |
| Ethiopians | 98.8 /100 | #102 | Exceptional $49,572 |
| Austrians | 98.7 /100 | #103 | Exceptional $49,501 |
| Immigrants | Brazil | 98.6 /100 | #104 | Exceptional $49,463 |
| Immigrants | Western Asia | 98.4 /100 | #105 | Exceptional $49,389 |
| Immigrants | Albania | 98.4 /100 | #106 | Exceptional $49,377 |
| Immigrants | Morocco | 98.4 /100 | #107 | Exceptional $49,368 |
| Palestinians | 98.0 /100 | #108 | Exceptional $49,209 |
| Syrians | 97.1 /100 | #109 | Exceptional $48,934 |
| Immigrants | Ethiopia | 97.1 /100 | #110 | Exceptional $48,924 |
| Immigrants | Zimbabwe | 97.0 /100 | #111 | Exceptional $48,913 |
| Northern Europeans | 96.9 /100 | #112 | Exceptional $48,887 |
| Immigrants | Kuwait | 96.8 /100 | #113 | Exceptional $48,861 |