Salvadoran vs Immigrants from Albania Average Family Size
COMPARE
Salvadoran
Immigrants from Albania
Average Family Size
Average Family Size Comparison
Salvadorans
Immigrants from Albania
3.48
AVERAGE FAMILY SIZE
100.0/ 100
METRIC RATING
18th/ 347
METRIC RANK
3.16
AVERAGE FAMILY SIZE
1.3/ 100
METRIC RATING
260th/ 347
METRIC RANK
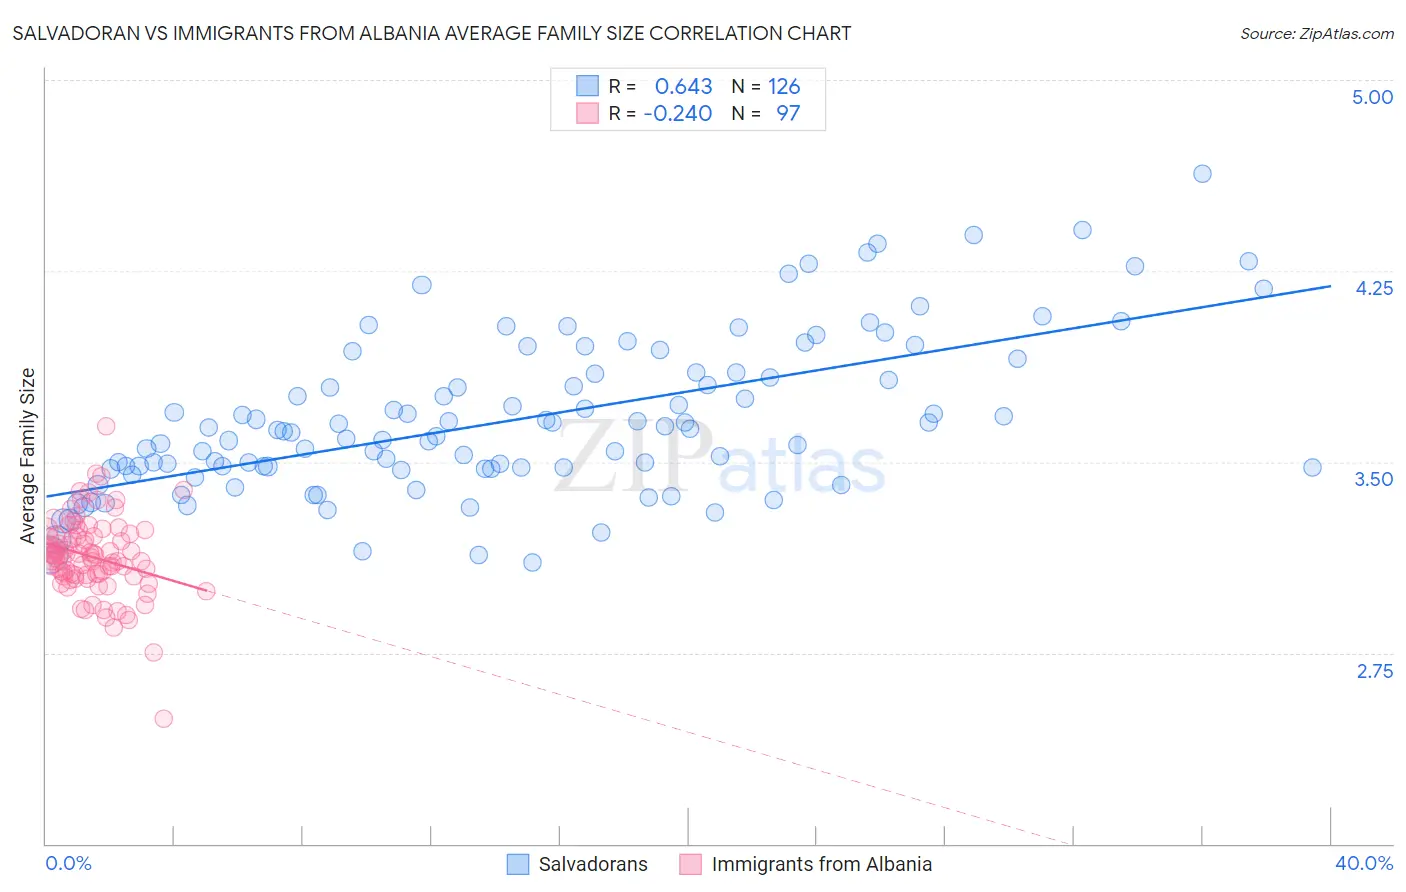
Salvadoran vs Immigrants from Albania Average Family Size Correlation Chart
The statistical analysis conducted on geographies consisting of 398,698,929 people shows a significant positive correlation between the proportion of Salvadorans and average family size in the United States with a correlation coefficient (R) of 0.643 and weighted average of 3.48. Similarly, the statistical analysis conducted on geographies consisting of 119,382,596 people shows a weak negative correlation between the proportion of Immigrants from Albania and average family size in the United States with a correlation coefficient (R) of -0.240 and weighted average of 3.16, a difference of 9.9%.
Average Family Size Correlation Summary
| Measurement | Salvadoran | Immigrants from Albania |
| Minimum | 3.10 | 2.49 |
| Maximum | 4.63 | 3.64 |
| Range | 1.53 | 1.15 |
| Mean | 3.67 | 3.13 |
| Median | 3.62 | 3.13 |
| Interquartile 25% (IQ1) | 3.47 | 3.05 |
| Interquartile 75% (IQ3) | 3.85 | 3.21 |
| Interquartile Range (IQR) | 0.37 | 0.16 |
| Standard Deviation (Sample) | 0.31 | 0.16 |
| Standard Deviation (Population) | 0.31 | 0.16 |
Similar Demographics by Average Family Size
Demographics Similar to Salvadorans by Average Family Size
In terms of average family size, the demographic groups most similar to Salvadorans are Mexican (3.48, a difference of 0.070%), Cheyenne (3.47, a difference of 0.11%), Immigrants from El Salvador (3.49, a difference of 0.25%), Ute (3.49, a difference of 0.34%), and Yuman (3.47, a difference of 0.36%).
| Demographics | Rating | Rank | Average Family Size |
| Tohono O'odham | 100.0 /100 | #11 | Exceptional 3.53 |
| Immigrants | Mexico | 100.0 /100 | #12 | Exceptional 3.52 |
| Sioux | 100.0 /100 | #13 | Exceptional 3.52 |
| Immigrants | Central America | 100.0 /100 | #14 | Exceptional 3.49 |
| Tongans | 100.0 /100 | #15 | Exceptional 3.49 |
| Ute | 100.0 /100 | #16 | Exceptional 3.49 |
| Immigrants | El Salvador | 100.0 /100 | #17 | Exceptional 3.49 |
| Salvadorans | 100.0 /100 | #18 | Exceptional 3.48 |
| Mexicans | 100.0 /100 | #19 | Exceptional 3.48 |
| Cheyenne | 100.0 /100 | #20 | Exceptional 3.47 |
| Yuman | 100.0 /100 | #21 | Exceptional 3.47 |
| Apache | 100.0 /100 | #22 | Exceptional 3.46 |
| Immigrants | Fiji | 100.0 /100 | #23 | Exceptional 3.45 |
| Natives/Alaskans | 100.0 /100 | #24 | Exceptional 3.45 |
| Yakama | 100.0 /100 | #25 | Exceptional 3.45 |
Demographics Similar to Immigrants from Albania by Average Family Size
In terms of average family size, the demographic groups most similar to Immigrants from Albania are Potawatomi (3.16, a difference of 0.0%), Turkish (3.16, a difference of 0.010%), Immigrants from North Macedonia (3.16, a difference of 0.010%), Immigrants from Russia (3.16, a difference of 0.010%), and Albanian (3.17, a difference of 0.060%).
| Demographics | Rating | Rank | Average Family Size |
| South Africans | 1.7 /100 | #253 | Tragic 3.17 |
| Immigrants | Hungary | 1.7 /100 | #254 | Tragic 3.17 |
| Cape Verdeans | 1.6 /100 | #255 | Tragic 3.17 |
| Immigrants | Kazakhstan | 1.5 /100 | #256 | Tragic 3.17 |
| Albanians | 1.5 /100 | #257 | Tragic 3.17 |
| Turks | 1.3 /100 | #258 | Tragic 3.16 |
| Potawatomi | 1.3 /100 | #259 | Tragic 3.16 |
| Immigrants | Albania | 1.3 /100 | #260 | Tragic 3.16 |
| Immigrants | North Macedonia | 1.3 /100 | #261 | Tragic 3.16 |
| Immigrants | Russia | 1.3 /100 | #262 | Tragic 3.16 |
| Immigrants | Bulgaria | 1.0 /100 | #263 | Tragic 3.16 |
| Americans | 1.0 /100 | #264 | Tragic 3.16 |
| Immigrants | South Africa | 0.9 /100 | #265 | Tragic 3.16 |
| Immigrants | Greece | 0.9 /100 | #266 | Tragic 3.16 |
| Iroquois | 0.8 /100 | #267 | Tragic 3.16 |