Ugandan vs Cherokee Average Family Size
COMPARE
Ugandan
Cherokee
Average Family Size
Average Family Size Comparison
Ugandans
Cherokee
3.23
AVERAGE FAMILY SIZE
58.4/ 100
METRIC RATING
165th/ 347
METRIC RANK
3.18
AVERAGE FAMILY SIZE
4.7/ 100
METRIC RATING
232nd/ 347
METRIC RANK
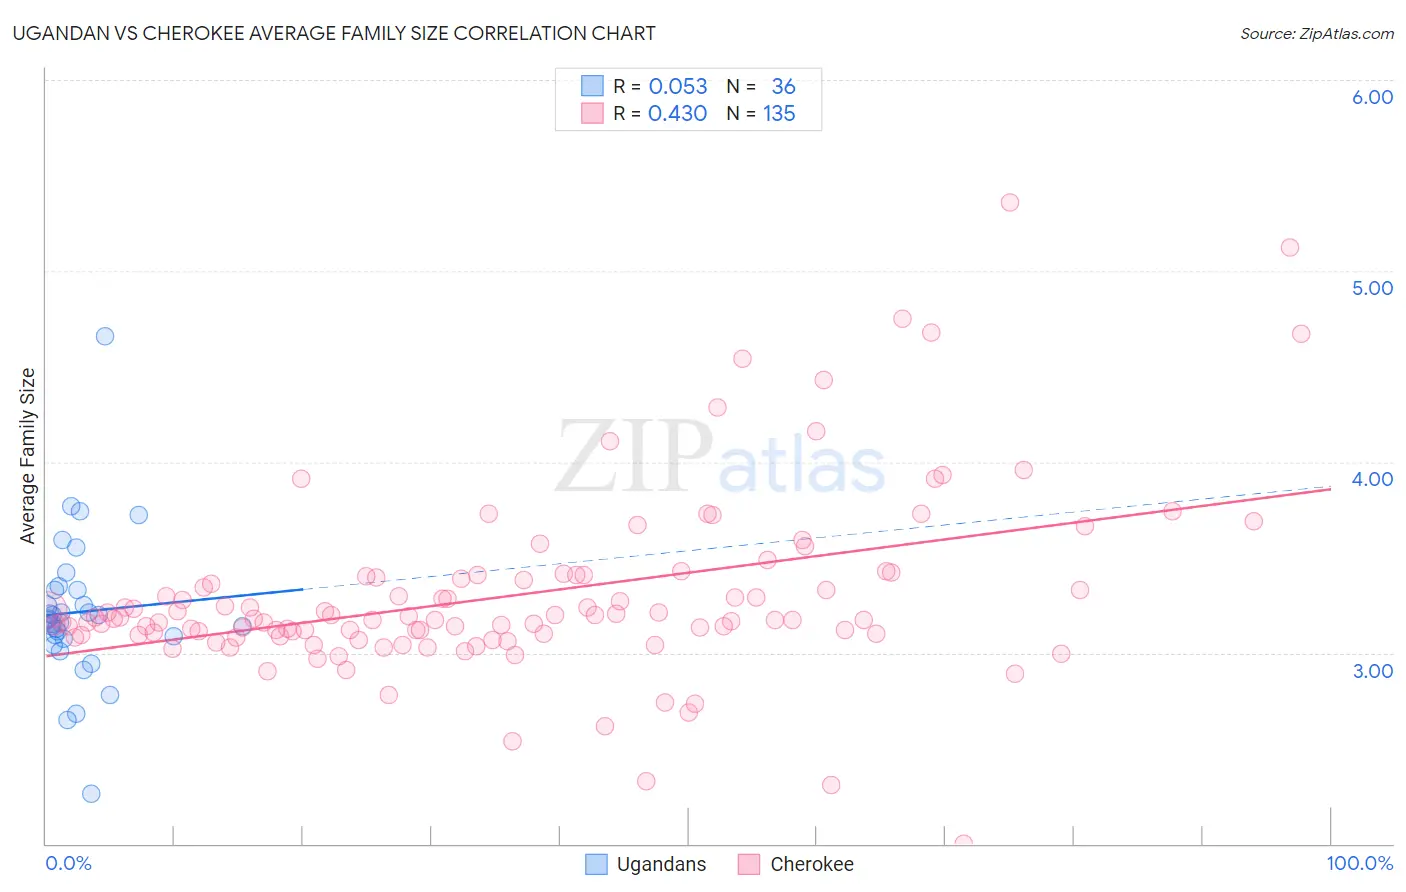
Ugandan vs Cherokee Average Family Size Correlation Chart
The statistical analysis conducted on geographies consisting of 93,998,632 people shows a slight positive correlation between the proportion of Ugandans and average family size in the United States with a correlation coefficient (R) of 0.053 and weighted average of 3.23. Similarly, the statistical analysis conducted on geographies consisting of 493,383,050 people shows a moderate positive correlation between the proportion of Cherokee and average family size in the United States with a correlation coefficient (R) of 0.430 and weighted average of 3.18, a difference of 1.5%.
Average Family Size Correlation Summary
| Measurement | Ugandan | Cherokee |
| Minimum | 2.26 | 2.00 |
| Maximum | 4.66 | 5.36 |
| Range | 2.40 | 3.36 |
| Mean | 3.21 | 3.30 |
| Median | 3.17 | 3.18 |
| Interquartile 25% (IQ1) | 3.08 | 3.09 |
| Interquartile 75% (IQ3) | 3.33 | 3.40 |
| Interquartile Range (IQR) | 0.25 | 0.30 |
| Standard Deviation (Sample) | 0.39 | 0.48 |
| Standard Deviation (Population) | 0.38 | 0.48 |
Similar Demographics by Average Family Size
Demographics Similar to Ugandans by Average Family Size
In terms of average family size, the demographic groups most similar to Ugandans are Egyptian (3.23, a difference of 0.0%), Uruguayan (3.23, a difference of 0.010%), Immigrants from Senegal (3.23, a difference of 0.020%), Immigrants from Uganda (3.23, a difference of 0.030%), and Dutch West Indian (3.23, a difference of 0.030%).
| Demographics | Rating | Rank | Average Family Size |
| Iraqis | 64.3 /100 | #158 | Good 3.24 |
| Ethiopians | 63.9 /100 | #159 | Good 3.24 |
| Immigrants | Iraq | 63.7 /100 | #160 | Good 3.24 |
| Immigrants | Chile | 63.2 /100 | #161 | Good 3.24 |
| Immigrants | Uganda | 60.1 /100 | #162 | Good 3.23 |
| Uruguayans | 58.8 /100 | #163 | Average 3.23 |
| Egyptians | 58.6 /100 | #164 | Average 3.23 |
| Ugandans | 58.4 /100 | #165 | Average 3.23 |
| Immigrants | Senegal | 57.5 /100 | #166 | Average 3.23 |
| Dutch West Indians | 56.9 /100 | #167 | Average 3.23 |
| Taiwanese | 54.2 /100 | #168 | Average 3.23 |
| Aleuts | 54.1 /100 | #169 | Average 3.23 |
| Arabs | 53.8 /100 | #170 | Average 3.23 |
| Chileans | 53.2 /100 | #171 | Average 3.23 |
| Immigrants | Congo | 52.7 /100 | #172 | Average 3.23 |
Demographics Similar to Cherokee by Average Family Size
In terms of average family size, the demographic groups most similar to Cherokee are Brazilian (3.18, a difference of 0.020%), Iranian (3.18, a difference of 0.030%), Icelander (3.19, a difference of 0.040%), Basque (3.19, a difference of 0.040%), and Immigrants from Turkey (3.18, a difference of 0.050%).
| Demographics | Rating | Rank | Average Family Size |
| Cree | 6.2 /100 | #225 | Tragic 3.19 |
| Chickasaw | 6.0 /100 | #226 | Tragic 3.19 |
| Portuguese | 6.0 /100 | #227 | Tragic 3.19 |
| Immigrants | Nonimmigrants | 5.7 /100 | #228 | Tragic 3.19 |
| Immigrants | Italy | 5.3 /100 | #229 | Tragic 3.19 |
| Icelanders | 5.2 /100 | #230 | Tragic 3.19 |
| Basques | 5.2 /100 | #231 | Tragic 3.19 |
| Cherokee | 4.7 /100 | #232 | Tragic 3.18 |
| Brazilians | 4.5 /100 | #233 | Tragic 3.18 |
| Iranians | 4.5 /100 | #234 | Tragic 3.18 |
| Immigrants | Turkey | 4.2 /100 | #235 | Tragic 3.18 |
| Immigrants | Portugal | 4.2 /100 | #236 | Tragic 3.18 |
| Immigrants | Romania | 3.7 /100 | #237 | Tragic 3.18 |
| Romanians | 3.7 /100 | #238 | Tragic 3.18 |
| Houma | 3.4 /100 | #239 | Tragic 3.18 |