Pakistani vs Cherokee 3rd Grade
COMPARE
Pakistani
Cherokee
3rd Grade
3rd Grade Comparison
Pakistanis
Cherokee
97.7%
3RD GRADE
34.2/ 100
METRIC RATING
189th/ 347
METRIC RANK
98.2%
3RD GRADE
99.3/ 100
METRIC RATING
75th/ 347
METRIC RANK
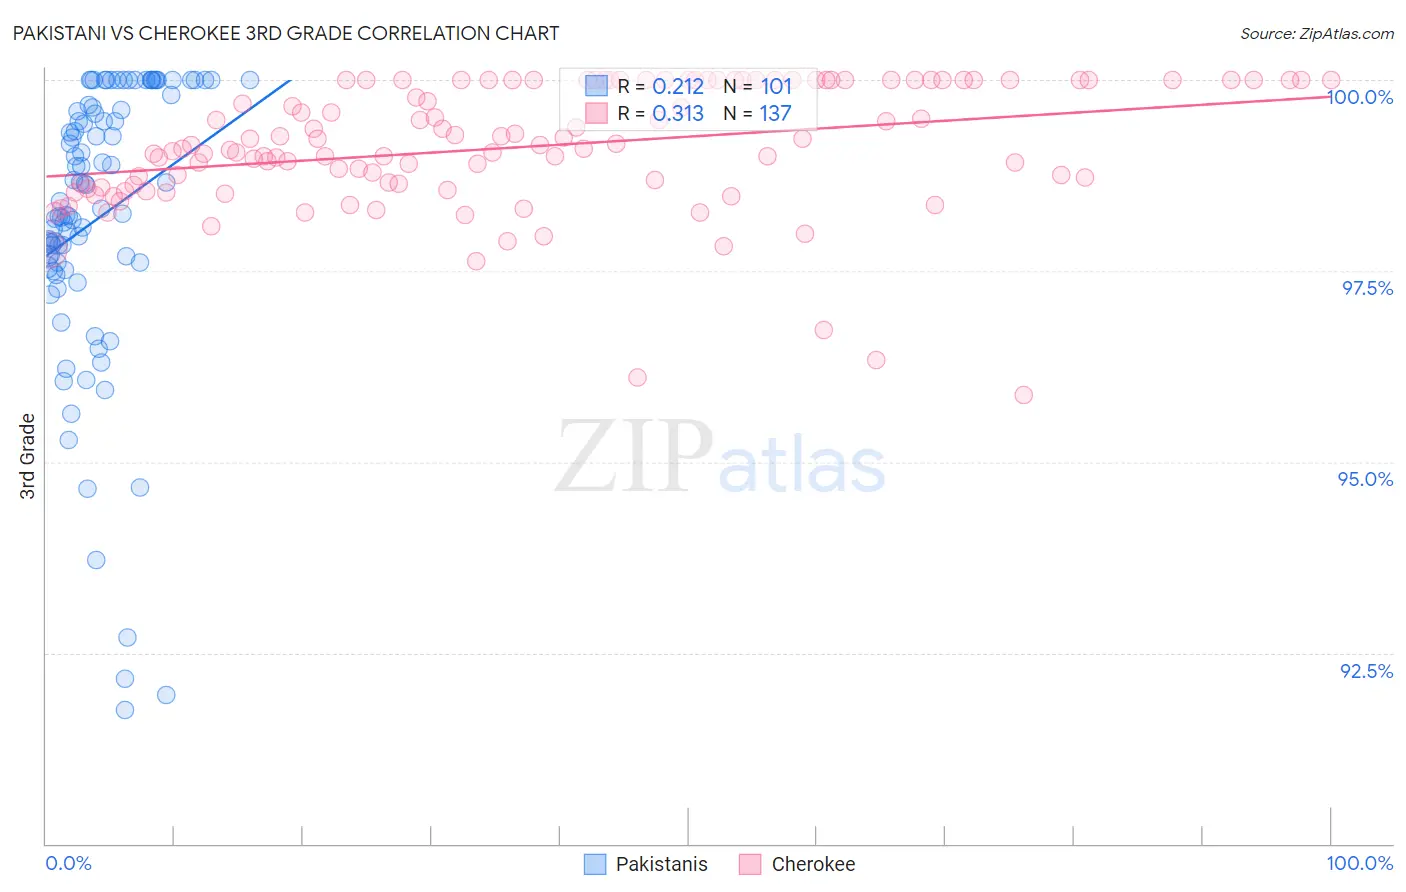
Pakistani vs Cherokee 3rd Grade Correlation Chart
The statistical analysis conducted on geographies consisting of 335,355,370 people shows a weak positive correlation between the proportion of Pakistanis and percentage of population with at least 3rd grade education in the United States with a correlation coefficient (R) of 0.212 and weighted average of 97.7%. Similarly, the statistical analysis conducted on geographies consisting of 493,719,253 people shows a mild positive correlation between the proportion of Cherokee and percentage of population with at least 3rd grade education in the United States with a correlation coefficient (R) of 0.313 and weighted average of 98.2%, a difference of 0.47%.
3rd Grade Correlation Summary
| Measurement | Pakistani | Cherokee |
| Minimum | 91.8% | 95.9% |
| Maximum | 100.0% | 100.0% |
| Range | 8.2% | 4.1% |
| Mean | 98.2% | 99.1% |
| Median | 98.4% | 99.1% |
| Interquartile 25% (IQ1) | 97.6% | 98.6% |
| Interquartile 75% (IQ3) | 99.7% | 100.0% |
| Interquartile Range (IQR) | 2.1% | 1.4% |
| Standard Deviation (Sample) | 1.9% | 0.83% |
| Standard Deviation (Population) | 1.9% | 0.83% |
Similar Demographics by 3rd Grade
Demographics Similar to Pakistanis by 3rd Grade
In terms of 3rd grade, the demographic groups most similar to Pakistanis are Native/Alaskan (97.7%, a difference of 0.0%), Immigrants from Taiwan (97.7%, a difference of 0.0%), Immigrants from Kazakhstan (97.7%, a difference of 0.010%), Immigrants from Argentina (97.7%, a difference of 0.010%), and Portuguese (97.7%, a difference of 0.010%).
| Demographics | Rating | Rank | 3rd Grade |
| Argentineans | 42.9 /100 | #182 | Average 97.7% |
| Arabs | 40.0 /100 | #183 | Fair 97.7% |
| Immigrants | Kazakhstan | 37.4 /100 | #184 | Fair 97.7% |
| Immigrants | Argentina | 37.0 /100 | #185 | Fair 97.7% |
| Portuguese | 36.2 /100 | #186 | Fair 97.7% |
| Natives/Alaskans | 35.2 /100 | #187 | Fair 97.7% |
| Immigrants | Taiwan | 34.2 /100 | #188 | Fair 97.7% |
| Pakistanis | 34.2 /100 | #189 | Fair 97.7% |
| Panamanians | 31.5 /100 | #190 | Fair 97.7% |
| Blacks/African Americans | 29.6 /100 | #191 | Fair 97.7% |
| Mongolians | 29.1 /100 | #192 | Fair 97.7% |
| Immigrants | Kenya | 28.2 /100 | #193 | Fair 97.7% |
| Immigrants | Uganda | 27.4 /100 | #194 | Fair 97.7% |
| Immigrants | Egypt | 26.8 /100 | #195 | Fair 97.7% |
| Paraguayans | 26.2 /100 | #196 | Fair 97.7% |
Demographics Similar to Cherokee by 3rd Grade
In terms of 3rd grade, the demographic groups most similar to Cherokee are Immigrants from Netherlands (98.2%, a difference of 0.0%), Immigrants from England (98.2%, a difference of 0.0%), Cheyenne (98.2%, a difference of 0.010%), Immigrants from Lithuania (98.2%, a difference of 0.010%), and Osage (98.2%, a difference of 0.010%).
| Demographics | Rating | Rank | 3rd Grade |
| Immigrants | Northern Europe | 99.6 /100 | #68 | Exceptional 98.2% |
| Canadians | 99.6 /100 | #69 | Exceptional 98.2% |
| Cajuns | 99.6 /100 | #70 | Exceptional 98.2% |
| Immigrants | Austria | 99.6 /100 | #71 | Exceptional 98.2% |
| Chickasaw | 99.5 /100 | #72 | Exceptional 98.2% |
| Cheyenne | 99.3 /100 | #73 | Exceptional 98.2% |
| Immigrants | Netherlands | 99.3 /100 | #74 | Exceptional 98.2% |
| Cherokee | 99.3 /100 | #75 | Exceptional 98.2% |
| Immigrants | England | 99.2 /100 | #76 | Exceptional 98.2% |
| Immigrants | Lithuania | 99.2 /100 | #77 | Exceptional 98.2% |
| Osage | 99.2 /100 | #78 | Exceptional 98.2% |
| Immigrants | Belgium | 99.1 /100 | #79 | Exceptional 98.1% |
| Macedonians | 99.1 /100 | #80 | Exceptional 98.1% |
| Icelanders | 99.1 /100 | #81 | Exceptional 98.1% |
| Shoshone | 99.0 /100 | #82 | Exceptional 98.1% |