English vs Cherokee Average Family Size
COMPARE
English
Cherokee
Average Family Size
Average Family Size Comparison
English
Cherokee
3.11
AVERAGE FAMILY SIZE
0.0/ 100
METRIC RATING
325th/ 347
METRIC RANK
3.18
AVERAGE FAMILY SIZE
4.7/ 100
METRIC RATING
232nd/ 347
METRIC RANK
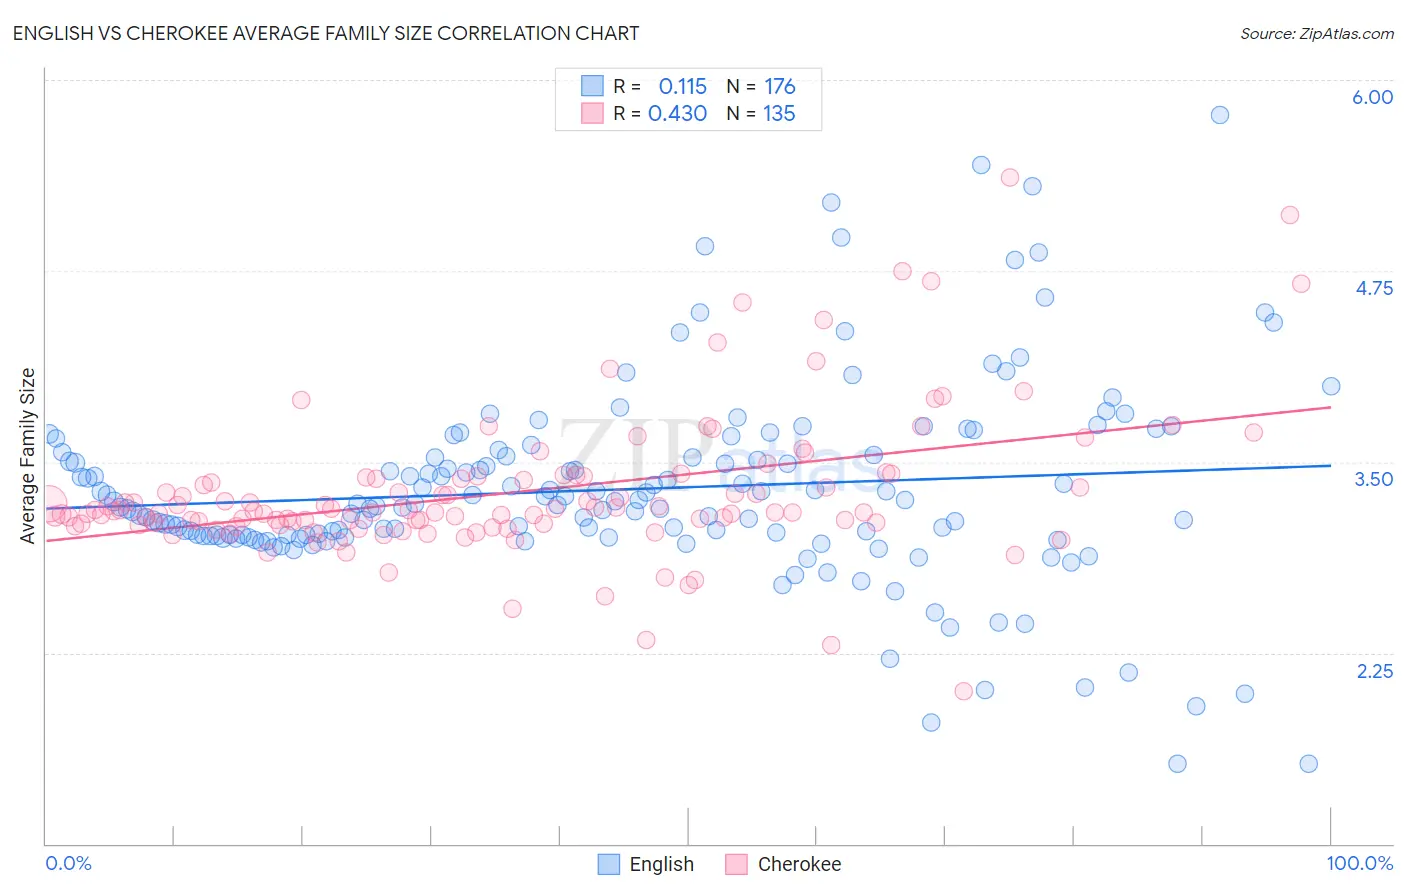
English vs Cherokee Average Family Size Correlation Chart
The statistical analysis conducted on geographies consisting of 579,316,351 people shows a poor positive correlation between the proportion of English and average family size in the United States with a correlation coefficient (R) of 0.115 and weighted average of 3.11. Similarly, the statistical analysis conducted on geographies consisting of 493,383,050 people shows a moderate positive correlation between the proportion of Cherokee and average family size in the United States with a correlation coefficient (R) of 0.430 and weighted average of 3.18, a difference of 2.4%.
Average Family Size Correlation Summary
| Measurement | English | Cherokee |
| Minimum | 1.52 | 2.00 |
| Maximum | 5.77 | 5.36 |
| Range | 4.25 | 3.36 |
| Mean | 3.32 | 3.30 |
| Median | 3.22 | 3.18 |
| Interquartile 25% (IQ1) | 3.02 | 3.09 |
| Interquartile 75% (IQ3) | 3.54 | 3.40 |
| Interquartile Range (IQR) | 0.52 | 0.30 |
| Standard Deviation (Sample) | 0.64 | 0.48 |
| Standard Deviation (Population) | 0.64 | 0.48 |
Similar Demographics by Average Family Size
Demographics Similar to English by Average Family Size
In terms of average family size, the demographic groups most similar to English are Celtic (3.11, a difference of 0.040%), Ottawa (3.11, a difference of 0.050%), Dutch (3.11, a difference of 0.060%), Czech (3.11, a difference of 0.060%), and Soviet Union (3.11, a difference of 0.12%).
| Demographics | Rating | Rank | Average Family Size |
| Eastern Europeans | 0.1 /100 | #318 | Tragic 3.12 |
| Welsh | 0.1 /100 | #319 | Tragic 3.12 |
| Immigrants | North America | 0.0 /100 | #320 | Tragic 3.12 |
| Immigrants | Austria | 0.0 /100 | #321 | Tragic 3.12 |
| Immigrants | Canada | 0.0 /100 | #322 | Tragic 3.12 |
| Soviet Union | 0.0 /100 | #323 | Tragic 3.11 |
| Celtics | 0.0 /100 | #324 | Tragic 3.11 |
| English | 0.0 /100 | #325 | Tragic 3.11 |
| Ottawa | 0.0 /100 | #326 | Tragic 3.11 |
| Dutch | 0.0 /100 | #327 | Tragic 3.11 |
| Czechs | 0.0 /100 | #328 | Tragic 3.11 |
| Belgians | 0.0 /100 | #329 | Tragic 3.11 |
| Latvians | 0.0 /100 | #330 | Tragic 3.11 |
| Scotch-Irish | 0.0 /100 | #331 | Tragic 3.11 |
| Scottish | 0.0 /100 | #332 | Tragic 3.11 |
Demographics Similar to Cherokee by Average Family Size
In terms of average family size, the demographic groups most similar to Cherokee are Brazilian (3.18, a difference of 0.020%), Iranian (3.18, a difference of 0.030%), Icelander (3.19, a difference of 0.040%), Basque (3.19, a difference of 0.040%), and Immigrants from Turkey (3.18, a difference of 0.050%).
| Demographics | Rating | Rank | Average Family Size |
| Cree | 6.2 /100 | #225 | Tragic 3.19 |
| Chickasaw | 6.0 /100 | #226 | Tragic 3.19 |
| Portuguese | 6.0 /100 | #227 | Tragic 3.19 |
| Immigrants | Nonimmigrants | 5.7 /100 | #228 | Tragic 3.19 |
| Immigrants | Italy | 5.3 /100 | #229 | Tragic 3.19 |
| Icelanders | 5.2 /100 | #230 | Tragic 3.19 |
| Basques | 5.2 /100 | #231 | Tragic 3.19 |
| Cherokee | 4.7 /100 | #232 | Tragic 3.18 |
| Brazilians | 4.5 /100 | #233 | Tragic 3.18 |
| Iranians | 4.5 /100 | #234 | Tragic 3.18 |
| Immigrants | Turkey | 4.2 /100 | #235 | Tragic 3.18 |
| Immigrants | Portugal | 4.2 /100 | #236 | Tragic 3.18 |
| Immigrants | Romania | 3.7 /100 | #237 | Tragic 3.18 |
| Romanians | 3.7 /100 | #238 | Tragic 3.18 |
| Houma | 3.4 /100 | #239 | Tragic 3.18 |