Native/Alaskan vs Icelander Births to Unmarried Women
COMPARE
Native/Alaskan
Icelander
Births to Unmarried Women
Births to Unmarried Women Comparison
Natives/Alaskans
Icelanders
43.0%
BIRTHS TO UNMARRIED WOMEN
0.0/ 100
METRIC RATING
331st/ 347
METRIC RANK
30.3%
BIRTHS TO UNMARRIED WOMEN
86.0/ 100
METRIC RATING
128th/ 347
METRIC RANK
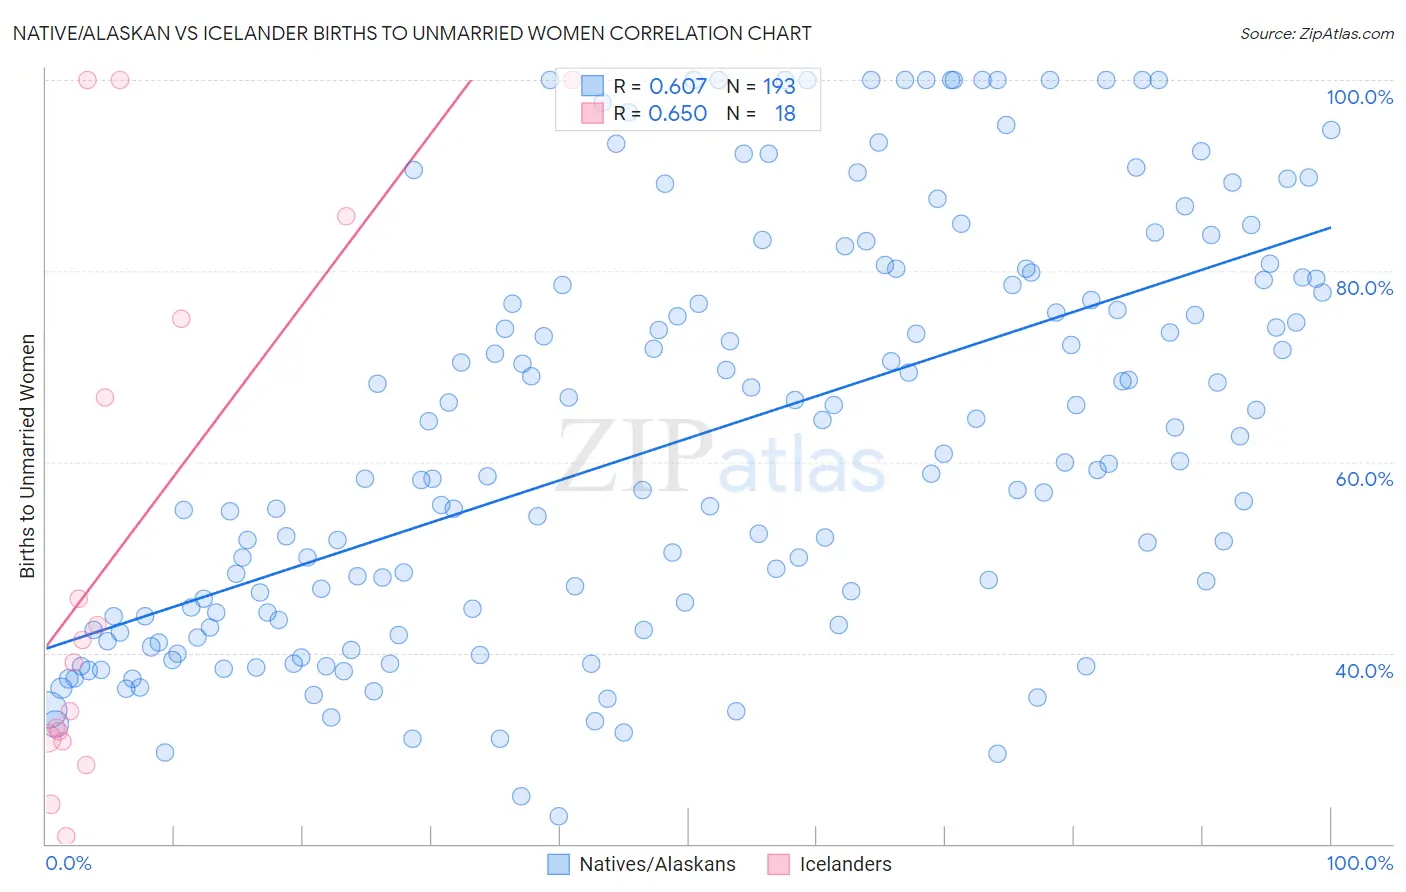
Native/Alaskan vs Icelander Births to Unmarried Women Correlation Chart
The statistical analysis conducted on geographies consisting of 471,404,476 people shows a significant positive correlation between the proportion of Natives/Alaskans and percentage of births to unmarried women in the United States with a correlation coefficient (R) of 0.607 and weighted average of 43.0%. Similarly, the statistical analysis conducted on geographies consisting of 153,143,056 people shows a significant positive correlation between the proportion of Icelanders and percentage of births to unmarried women in the United States with a correlation coefficient (R) of 0.650 and weighted average of 30.3%, a difference of 41.8%.
Births to Unmarried Women Correlation Summary
| Measurement | Native/Alaskan | Icelander |
| Minimum | 22.9% | 20.8% |
| Maximum | 100.0% | 100.0% |
| Range | 77.1% | 79.2% |
| Mean | 62.5% | 51.6% |
| Median | 59.8% | 40.2% |
| Interquartile 25% (IQ1) | 43.2% | 31.0% |
| Interquartile 75% (IQ3) | 79.1% | 75.0% |
| Interquartile Range (IQR) | 35.9% | 44.0% |
| Standard Deviation (Sample) | 21.3% | 28.2% |
| Standard Deviation (Population) | 21.3% | 27.4% |
Similar Demographics by Births to Unmarried Women
Demographics Similar to Natives/Alaskans by Births to Unmarried Women
In terms of births to unmarried women, the demographic groups most similar to Natives/Alaskans are Kiowa (43.1%, a difference of 0.35%), Chippewa (42.6%, a difference of 0.83%), Paiute (42.5%, a difference of 1.2%), Immigrants from Cabo Verde (42.2%, a difference of 1.8%), and Tsimshian (42.2%, a difference of 2.0%).
| Demographics | Rating | Rank | Births to Unmarried Women |
| Cape Verdeans | 0.0 /100 | #324 | Tragic 41.3% |
| Cheyenne | 0.0 /100 | #325 | Tragic 41.3% |
| Immigrants | Cuba | 0.0 /100 | #326 | Tragic 41.5% |
| Tsimshian | 0.0 /100 | #327 | Tragic 42.2% |
| Immigrants | Cabo Verde | 0.0 /100 | #328 | Tragic 42.2% |
| Paiute | 0.0 /100 | #329 | Tragic 42.5% |
| Chippewa | 0.0 /100 | #330 | Tragic 42.6% |
| Natives/Alaskans | 0.0 /100 | #331 | Tragic 43.0% |
| Kiowa | 0.0 /100 | #332 | Tragic 43.1% |
| Blacks/African Americans | 0.0 /100 | #333 | Tragic 44.3% |
| Yuman | 0.0 /100 | #334 | Tragic 44.4% |
| Colville | 0.0 /100 | #335 | Tragic 45.3% |
| Puerto Ricans | 0.0 /100 | #336 | Tragic 45.7% |
| Houma | 0.0 /100 | #337 | Tragic 46.6% |
| Arapaho | 0.0 /100 | #338 | Tragic 47.1% |
Demographics Similar to Icelanders by Births to Unmarried Women
In terms of births to unmarried women, the demographic groups most similar to Icelanders are Immigrants from Spain (30.3%, a difference of 0.040%), Immigrants from Bosnia and Herzegovina (30.3%, a difference of 0.050%), Immigrants from Zimbabwe (30.3%, a difference of 0.060%), New Zealander (30.3%, a difference of 0.10%), and Immigrants from Morocco (30.4%, a difference of 0.15%).
| Demographics | Rating | Rank | Births to Unmarried Women |
| Koreans | 88.9 /100 | #121 | Excellent 30.1% |
| Immigrants | Argentina | 88.7 /100 | #122 | Excellent 30.1% |
| Syrians | 88.2 /100 | #123 | Excellent 30.2% |
| Croatians | 88.0 /100 | #124 | Excellent 30.2% |
| Vietnamese | 87.7 /100 | #125 | Excellent 30.2% |
| Europeans | 87.2 /100 | #126 | Excellent 30.2% |
| Chinese | 87.1 /100 | #127 | Excellent 30.2% |
| Icelanders | 86.0 /100 | #128 | Excellent 30.3% |
| Immigrants | Spain | 85.8 /100 | #129 | Excellent 30.3% |
| Immigrants | Bosnia and Herzegovina | 85.7 /100 | #130 | Excellent 30.3% |
| Immigrants | Zimbabwe | 85.7 /100 | #131 | Excellent 30.3% |
| New Zealanders | 85.5 /100 | #132 | Excellent 30.3% |
| Immigrants | Morocco | 85.2 /100 | #133 | Excellent 30.4% |
| Immigrants | South Eastern Asia | 85.2 /100 | #134 | Excellent 30.4% |
| Brazilians | 84.8 /100 | #135 | Excellent 30.4% |