Native/Alaskan vs Senegalese Births to Unmarried Women
COMPARE
Native/Alaskan
Senegalese
Births to Unmarried Women
Births to Unmarried Women Comparison
Natives/Alaskans
Senegalese
43.0%
BIRTHS TO UNMARRIED WOMEN
0.0/ 100
METRIC RATING
331st/ 347
METRIC RANK
36.8%
BIRTHS TO UNMARRIED WOMEN
0.1/ 100
METRIC RATING
269th/ 347
METRIC RANK
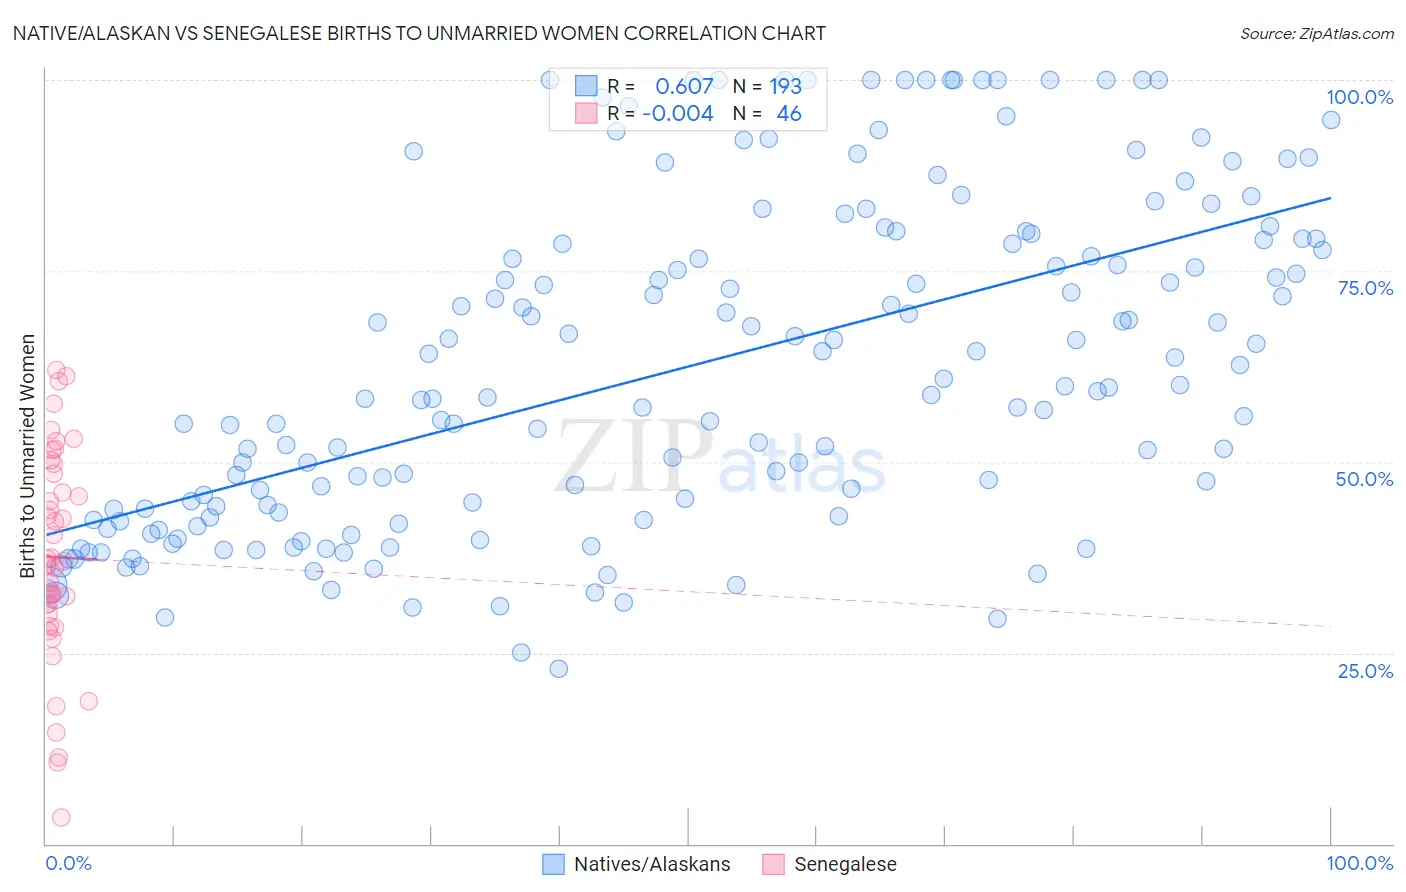
Native/Alaskan vs Senegalese Births to Unmarried Women Correlation Chart
The statistical analysis conducted on geographies consisting of 471,404,476 people shows a significant positive correlation between the proportion of Natives/Alaskans and percentage of births to unmarried women in the United States with a correlation coefficient (R) of 0.607 and weighted average of 43.0%. Similarly, the statistical analysis conducted on geographies consisting of 77,154,598 people shows no correlation between the proportion of Senegalese and percentage of births to unmarried women in the United States with a correlation coefficient (R) of -0.004 and weighted average of 36.8%, a difference of 16.9%.
Births to Unmarried Women Correlation Summary
| Measurement | Native/Alaskan | Senegalese |
| Minimum | 22.9% | 3.4% |
| Maximum | 100.0% | 62.0% |
| Range | 77.1% | 58.6% |
| Mean | 62.5% | 37.5% |
| Median | 59.8% | 36.8% |
| Interquartile 25% (IQ1) | 43.2% | 30.1% |
| Interquartile 75% (IQ3) | 79.1% | 48.4% |
| Interquartile Range (IQR) | 35.9% | 18.3% |
| Standard Deviation (Sample) | 21.3% | 13.8% |
| Standard Deviation (Population) | 21.3% | 13.7% |
Similar Demographics by Births to Unmarried Women
Demographics Similar to Natives/Alaskans by Births to Unmarried Women
In terms of births to unmarried women, the demographic groups most similar to Natives/Alaskans are Kiowa (43.1%, a difference of 0.35%), Chippewa (42.6%, a difference of 0.83%), Paiute (42.5%, a difference of 1.2%), Immigrants from Cabo Verde (42.2%, a difference of 1.8%), and Tsimshian (42.2%, a difference of 2.0%).
| Demographics | Rating | Rank | Births to Unmarried Women |
| Cape Verdeans | 0.0 /100 | #324 | Tragic 41.3% |
| Cheyenne | 0.0 /100 | #325 | Tragic 41.3% |
| Immigrants | Cuba | 0.0 /100 | #326 | Tragic 41.5% |
| Tsimshian | 0.0 /100 | #327 | Tragic 42.2% |
| Immigrants | Cabo Verde | 0.0 /100 | #328 | Tragic 42.2% |
| Paiute | 0.0 /100 | #329 | Tragic 42.5% |
| Chippewa | 0.0 /100 | #330 | Tragic 42.6% |
| Natives/Alaskans | 0.0 /100 | #331 | Tragic 43.0% |
| Kiowa | 0.0 /100 | #332 | Tragic 43.1% |
| Blacks/African Americans | 0.0 /100 | #333 | Tragic 44.3% |
| Yuman | 0.0 /100 | #334 | Tragic 44.4% |
| Colville | 0.0 /100 | #335 | Tragic 45.3% |
| Puerto Ricans | 0.0 /100 | #336 | Tragic 45.7% |
| Houma | 0.0 /100 | #337 | Tragic 46.6% |
| Arapaho | 0.0 /100 | #338 | Tragic 47.1% |
Demographics Similar to Senegalese by Births to Unmarried Women
In terms of births to unmarried women, the demographic groups most similar to Senegalese are Immigrants from Congo (36.8%, a difference of 0.080%), Immigrants from Barbados (36.8%, a difference of 0.10%), Comanche (36.7%, a difference of 0.12%), Central American (36.7%, a difference of 0.13%), and Immigrants from Senegal (36.7%, a difference of 0.20%).
| Demographics | Rating | Rank | Births to Unmarried Women |
| French American Indians | 0.1 /100 | #262 | Tragic 36.6% |
| Nicaraguans | 0.1 /100 | #263 | Tragic 36.6% |
| Sub-Saharan Africans | 0.1 /100 | #264 | Tragic 36.7% |
| Cherokee | 0.1 /100 | #265 | Tragic 36.7% |
| Immigrants | Senegal | 0.1 /100 | #266 | Tragic 36.7% |
| Central Americans | 0.1 /100 | #267 | Tragic 36.7% |
| Comanche | 0.1 /100 | #268 | Tragic 36.7% |
| Senegalese | 0.1 /100 | #269 | Tragic 36.8% |
| Immigrants | Congo | 0.1 /100 | #270 | Tragic 36.8% |
| Immigrants | Barbados | 0.1 /100 | #271 | Tragic 36.8% |
| Choctaw | 0.1 /100 | #272 | Tragic 36.9% |
| Mexicans | 0.1 /100 | #273 | Tragic 36.9% |
| Cree | 0.1 /100 | #274 | Tragic 37.0% |
| Barbadians | 0.1 /100 | #275 | Tragic 37.0% |
| Belizeans | 0.1 /100 | #276 | Tragic 37.0% |